Interpreting Pandemic-Related Decreases in Life Expectancy

Link:https://www.actuary.org/node/14837

Graphic:

Excerpt:

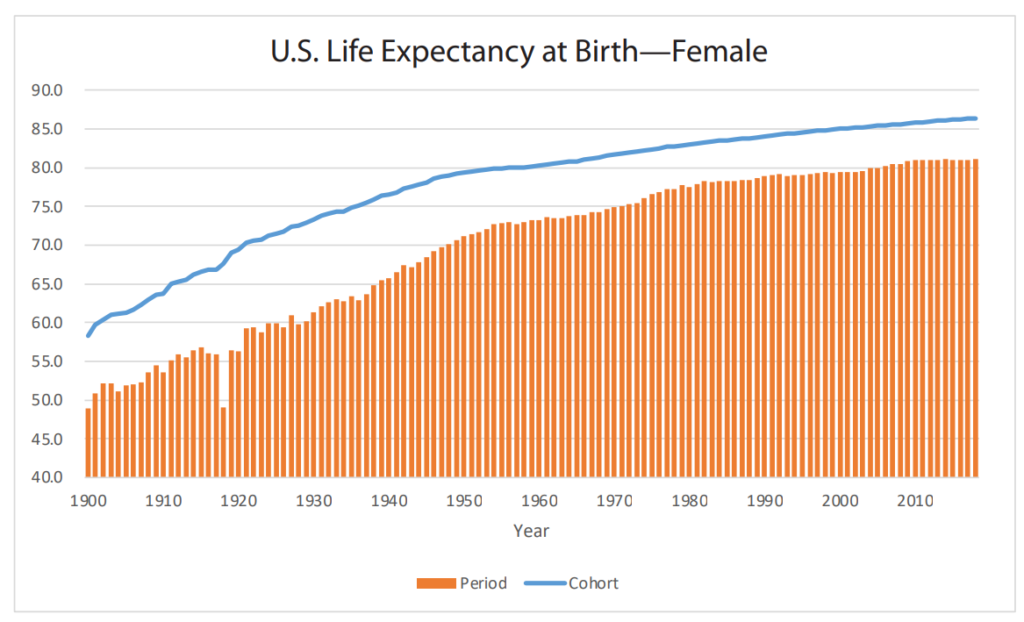
Period life expectancy measures demonstrate fluctuations that reflect events that influenced mortality in this particular period.14 For example, the Spanish flu pandemic of 1918 resulted in a dramatic decrease in period life expectancy, which was more than offset by an increase in period life expectancy the next year. A male baby born in 1917 had a period life expectancy of 52.2 years, while a male baby born in 1918 had a period life expectancy of only 45.3 years—a reduction of almost 7 years.15 The following year, a male newborn had a period life expectancy of 54.2, an increase of almost 9 years over the period life expectancy calculated in 1918 for a newborn male. These changes are much larger than those seen thus far with COVID-19, demonstrating the relative severity of that earlier pandemic relative to the current one.

It is instructive to review the impact of calculating life expectancies on a cohort basis, rather than a period basis, for these three cohorts of male newborns in the late 1910s. Using mortality rates published by the SSA for years after 1917, for a cohort of 1917 male newborns, the average life span was 59.4; for the 1918 cohort, average life span was 60.0; and for 1919, it was 61.5. Even these differences are heavily influenced by the fact that the 1917 and 1918 cohorts had to survive the high rates of death during 1918, while the 1919 cohort did not.

If both period and cohort life expectancy are measured as of 1920 for each of these groups (the 3-year-old children who were born in 1917, 2-year-old children who were born in 1918 and 1-year-old children who were born in 1919), differences are observed in these measures as they narrow substantially because the high rates of mortality during 1918 have no effect on those who survived to 1920. This is summarized in the table below.

Author(s): Pension Committee

Publication Date: December 2021

Publication Site: American Academy of Actuaries
Clarifying Misunderstanding of Life Expectancy and COVID-19

Link:https://www.actuary.org/sites/default/files/2022-02/EELifeExpectancy.pdf

Graphic:

Excerpt:

Basically, there are two life expectancy measures—
period life expectancy and cohort life expectancy.
Period life expectancy generally is based on the
assumption that current rates of death continue
indefinitely. Cohort life expectancy is more heavily
influenced by long-term expectations. Period life
expectancies can vary dramatically from one year to the
next when there is a short-term increase in mortality.

….

Period life expectancy can be a
useful metric for year-over-year
comparisons in normal times but
tends to exaggerate the effect of
nonrecurring events. Cohort life
expectancy is likely what most people
envision when thinking about the
concept of life expectancy because
cohort life expectancy is an estimate
of the actual number of years
that a typical individual might be
expected to live based on reasonable
expectations for future conditions.
For this reason, cohort life expectancy
is the measure used by the Actuaries
Longevity Illustrator that can help
individuals estimate how long they
might live.

Publication Date: Feb 2022

Publication Site: American Academy of Actuaries

USQS Roundtable—All About the Amended Standards

Link:https://contingencies.org/usqs-roundtable-all-about-the-amended-standards/

Excerpt:

TC: The work of the actuary is evolving more and more toward big data and artificial intelligence. In addition, we are seeing evolving regulatory and societal requirements that will place new demands on the actuary’s work. These new areas involve working with more unknowns in the tools actuaries use—such as data, models, algorithms, and assumptions. In order to be effective in these new areas, and to continue to earn the public’s trust in our work, we need to better understand what can impact the appropriateness and effectiveness of these tools. As these areas evolve, it is important for actuaries to understand the potential limits of these tools. This is where obtaining continuing education on bias topics can help. As the USQS lay out, bias topics may include “content that provides knowledge and perspective that assist in identifying and assessing biases that may exist in data, assumptions, algorithms, and models that impact Actuarial Services. Biases may include but are not limited to statistical, cognitive, and social biases.” This is a broad topic, but I believe it will better equip the actuary in our role of maintaining the public’s trust in insurance and pension systems.

LS: Indeed, bias topics are broad. When performing actuarial services there are so many ways that bias impacts our work that we need to keep the topic broad in order that the range of continuing education will give us the appropriate tools. The obvious ways that bias may impact our work are in selection of data, as well as designing, developing, selecting, modifying, or using all types of models and algorithms. Even more important is how we communicate the results of our work. We also operate in a world where we can individually be blindsided by biases that we bring to our work and impact the transparency and validity of the actuarial services that we are providing. Because of our basic education, we know what bias is. That is something that we can continue to fine-tune and will have significant benefits to the reputation of actuaries and allow us to further differentiate our professionalism compared with others, particularly many data scientists.

Publication Date: Jan/Feb 2022

Publication Site: Contingencies

Funding Public Pension Plans–Theory and Practice

Link:https://www.actuary.org/node/14815

Excerpt:

The Pension Practice Council’s Jan. 25 webinar, “Funding Public Pension Plans—Theory and Practice,” highlighted the Academy’s issue brief The 80% Pension Funding Myth; explored prudent funding practices; and examined considerations being made in the management of “surplus” for state and local public employee pension plans.

Presenters were Academy Pension Vice President Sherry Chan; Paul Angelo, a member of the Public Plans Committee; and Academy member David Lamoureux. Public Plans Committee Chairperson Todd Tauzer moderated.

Using the issue brief as a starting point, Tauzer laid the groundwork of the discussion in going over the basics of pension funding and a funded ratio. Funded ratios move in economic cycles and can be affected by assumption changes, and are also subject to varying asset valuations and liability measurements, he said.

Plan projections go beyond a point in time measurement and can illustrate plan trajectory, which is a more robust indicator of plan health over time. Nevertheless, funded ratios continue to be used ubiquitously. Tauzer highlighted additional considerations to bring context, like financial health and investment strategy of plan sponsor, history of benefit changes, and adherence to funding policy.

Publication Date: 25 Jan 2022

Publication Site: American Academy of Actuaries

The 80% Pension Funding Myth

Link:https://www.actuary.org/node/14645

Excerpt:

Using an 80% funded ratio as a benchmark for whether pension plans are healthy is inappropriate.

No single level of funding defines a line between a “healthy” and an “unhealthy” pension plan.

Pension plans are generally better evaluated on the strategy in place to attain a funded ratio of 100% within a reasonable period of time.

The financial health of a pension plan depends on many factors in addition to funded status— including the size of any shortfall compared with the resources of the plan sponsor.

Projections under a range of scenarios can be particularly useful in evaluating the plan’s expected funding trajectory and assessing plan health.

Author(s): Pension Practice Council

Publication Date: October 2021

Publication Site: American Academy of Actuaries

Actuaries project future virus surges, end of regulatory flexibility key drivers in 2022 rates

Link: https://www.fiercehealthcare.com/payer/actuaries-project-future-virus-surges-end-regulatory-flexibility-key-drivers-2022-rates

Excerpt:

Uncertainty over future surges of COVID-19 and the end of regulatory flexibilities are going to be major drivers for 2022 premiums on the individual and small group markets, a new actuary report finds.

The report, released Thursday (PDF) by the American Academy of Actuaries, finds insurers face major uncertainties like the end of the public health emergency and the fate of enhanced subsidies for coverage on the Affordable Care Act’s (ACA’s) insurance exchanges.

“Greater degrees of uncertainty could lead to more conservative assumptions and risk margins for some insurers,” the report said. “Alternatively, carriers might lower risk margins, seeing an opportunity to capitalize on the increased enrollment due to the [American Rescue Plan Act] subsidies.”

Author(s): Robert King

Publication Date: 2 September 2021

Publication Site: Fierce Healthcare

Actuarial Board for Counseling and Discipline: 2020 Annual Report

Link: http://www.abcdboard.org/wp-content/uploads/2021/03/ABCD-Annual-2020.pdf

Excerpt:

There were 47 inquiries in process with the ABCD during 2020, based on either complaints or adverse information.
Twenty-four of these were disposed of during 2020.

….

The ABCD members responded to 127 requests for guidance during 2020.

Publication Date: February 2021

Publication Site: Actuarial Board for Counseling and Discipline