#20: Many great things you missed this year

Link: https://www.scientificdiscovery.dev/p/20-so-many-great-things-you-missed

Graphic:
Excerpt:

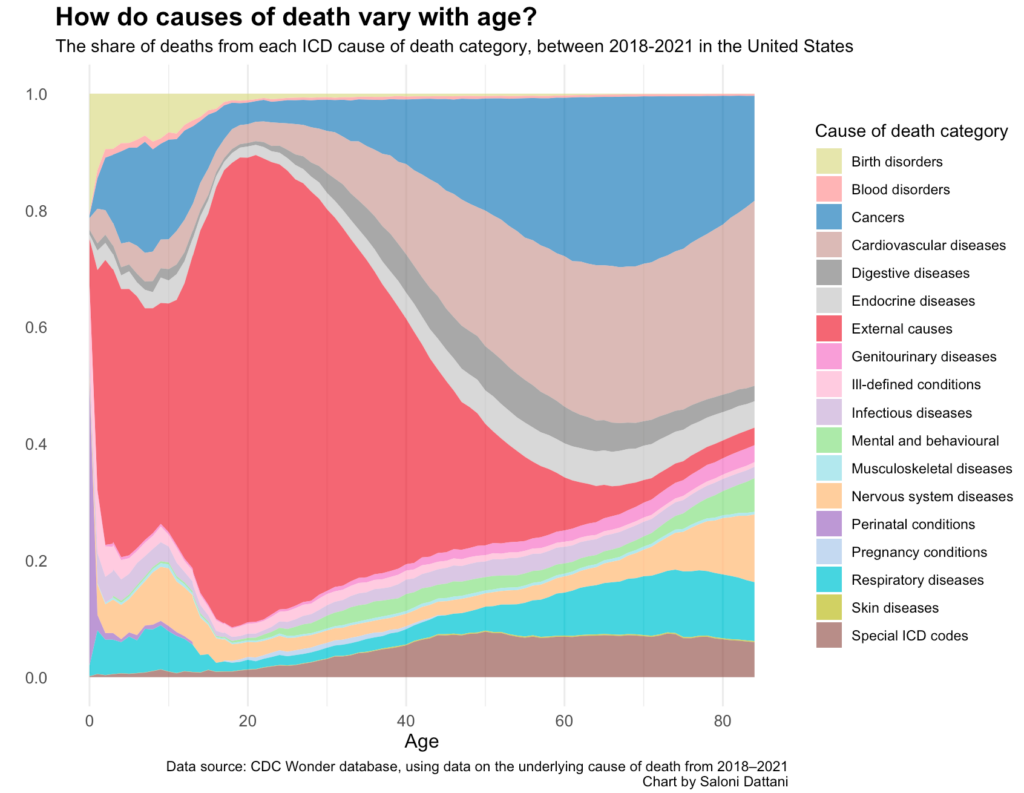
You can see that, in childhood, in the US, the most common causes of death are ‘external causes’. This is a broad category that includes accidents, falls, violence, and overdoses, and is shown in red. But there’s also a notable contribution from birth disorders (in muted green), childhood cancers (in blue), and respiratory diseases (in cyan).

The share of deaths in childhood from cancers stood out to me. We’ve seen lots of progress against many childhood cancers over the last 50 years — notably in treating leukemia, brain cancers, kidney cancers, lymphomas, and retinoblastoma — but this is a reminder that there’s still further to go.

From adolescence until middle-age, ‘external causes’ are now the overwhelming cause of death. Around 80% of deaths at the age of 20 in the US are due to external causes. These result from causes such as accidents, violence, and overdoses.

At older ages, diseases rise in importance. Causes of death also become more varied, although cardiovascular diseases and cancers are the most common.

You might also be wondering about the brown category at the bottom, called ‘special ICD codes’. That’s a placeholder category in the system for deaths caused by new diseases — predominantly Covid-19, since the data spans 2018 to 2021.3

Author(s): SALONI DATTANI

Publication Date: 16 Mar 2022

Publication Site: Scientific Discovery on substack

Deaths Among Older Adults Due to COVID-19 Jumped During the Summer of 2022 Before Falling Somewhat in September

Link: https://www.kff.org/coronavirus-covid-19/issue-brief/deaths-among-older-adults-due-to-covid-19-jumped-during-the-summer-of-2022-before-falling-somewhat-in-september/

Graphic:

Excerpt:

As of the week ending October 1, 2022, the United States has lost nearly 1.1 million lives to COVID-19, of which about 790,000 are people ages 65 and older. People 65 and older account for 16% of the total US population but 75% of all COVID deaths to date. Vaccinations, boosters, and treatments have led to a substantial decline in severe disease, hospitalizations, and deaths from COVID-19, but with booster uptake lagging, deaths for older adults rose again during the summer of 2022.

From April to July 2022, the number of deaths due to COVID increased for all ages but rose at a faster rate for older than younger adults and stayed high through August 2022, with deaths due to COVID topping 11,000 in both July and August among people 65 and older. While COVID deaths began to drop again in September, they were still higher for those ages 65 and older than in April or May; for those younger than 65, deaths dropped below their April levels.

The rise in deaths is primarily a function of increasing cases due to the more transmissible Omicron variant. Other factors include relatively low booster uptake, compared to primary vaccination, and waning vaccine immunity, underscoring the importance of staying up to date on vaccination. On September 1st, CDC recommended a new, updated booster for all those ages 12 and older, but particularly for those who are older.

Author(s): Meredith Freed Follow @meredith_freed on Twitter , Tricia Neuman Follow @tricia_neuman on Twitter , Jennifer Kates Follow @jenkatesdc on Twitter , and Juliette Cubanski Follow @jcubanski on Twitter

Publication Date: 6 Oct 2022

Publication Site: Kaiser Family Foundation

Covid Still Kills, but the Demographics of Its Victims Are Shifting

Link: https://khn.org/news/article/covid-still-kills-but-the-demographics-of-its-victims-are-shifting/

Graphic:

Excerpt:

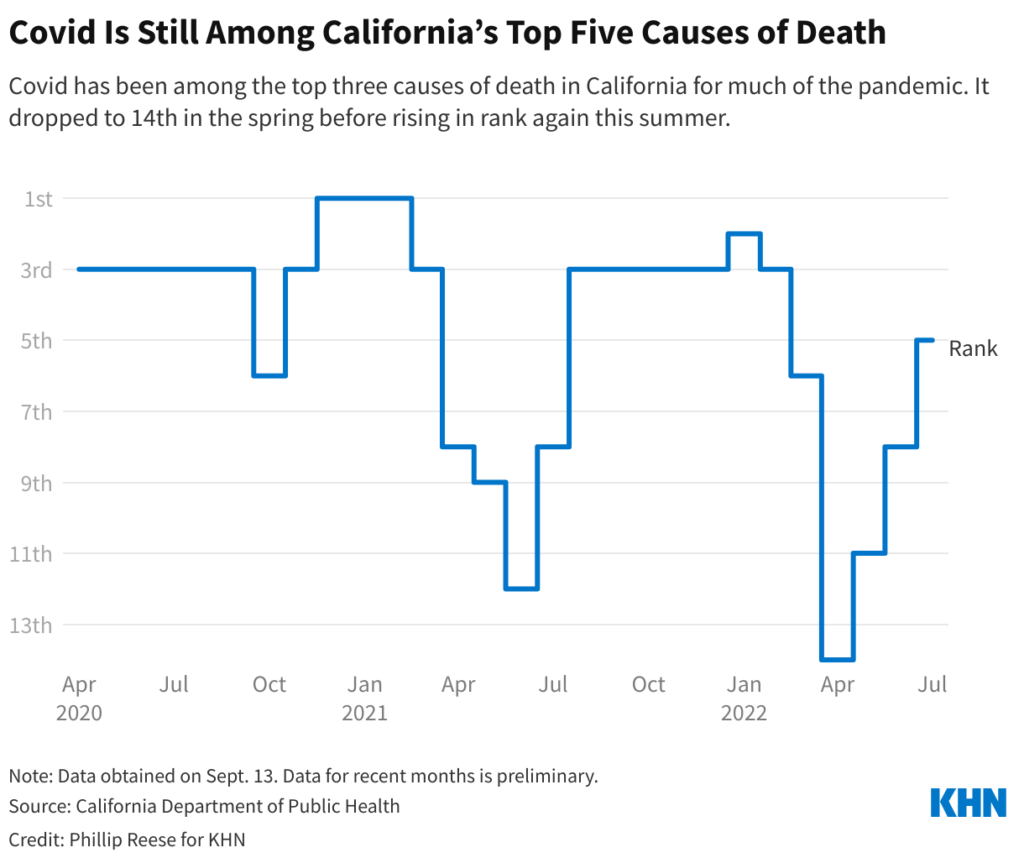
Californians age 75 and older made up 53% of covid deaths through July in 2022, up from 46% in 2020 and 2021. Only about 6% of the state’s residents are 75 and older. And white Californians 75 and older outnumber Latinos in that age group about 3 to 1.

In the initial vaccination rollout, California prioritized seniors, first responders, and other essential workers, and for several months in 2021 older residents were much more likely to be vaccinated than younger Californians.

“Now, the vaccination rates have caught up pretty much with everybody except for kids, people under 18,” Brewer said. “You’re seeing it go back to what we saw before, which is that age remains the most important risk factor for death.”

Author(s): Phillip Reese

Publication Date: SEPTEMBER 21, 2022

Publication Site: KFF

COVID-19 and the Short-Term Impact on Future U.S. Mortality

Link: https://www.soa.org/resources/research-reports/2022/covid-19-short-term-impact-us-mort/

PDF of report: https://www.soa.org/4a28d8/globalassets/assets/files/resources/research-report/2022/covid-19-short-term-impact-us-mort-report.pdf

Graphic:

Excerpt:

Excess mortality is expected to occur for all years studied with amounts varying by year and age.
Although the largest mortality excess numbers for the U.S. general population are foreseen for
2022, excess mortality is expected to decline each year so that by 2030, excess mortality numbers
are nearing expected levels. For 2030, mortality is projected to be 2% higher than expected for all
ages except age 85. At this age, 2030 projected mortality is estimated to be 1% higher than
expected.

Based on the average of the participants, generally, the amount of mortality excess is anticipated to be highest at the younger ages. For example, for 2022, projected mortality is anticipated to be 14% higher
compared to expected levels for age 25, 13% higher for age 45, and 10% higher for ages 65 and 85.

Author(s): Ronora Stryker, ASA, MAAA

Publication Date: August 2022

Publication Site: Society of Actuaries

Missing Americans: Early Death in the United States, 1933-2021

Link: https://www.medrxiv.org/content/10.1101/2022.06.29.22277065v1.full

Graphic:

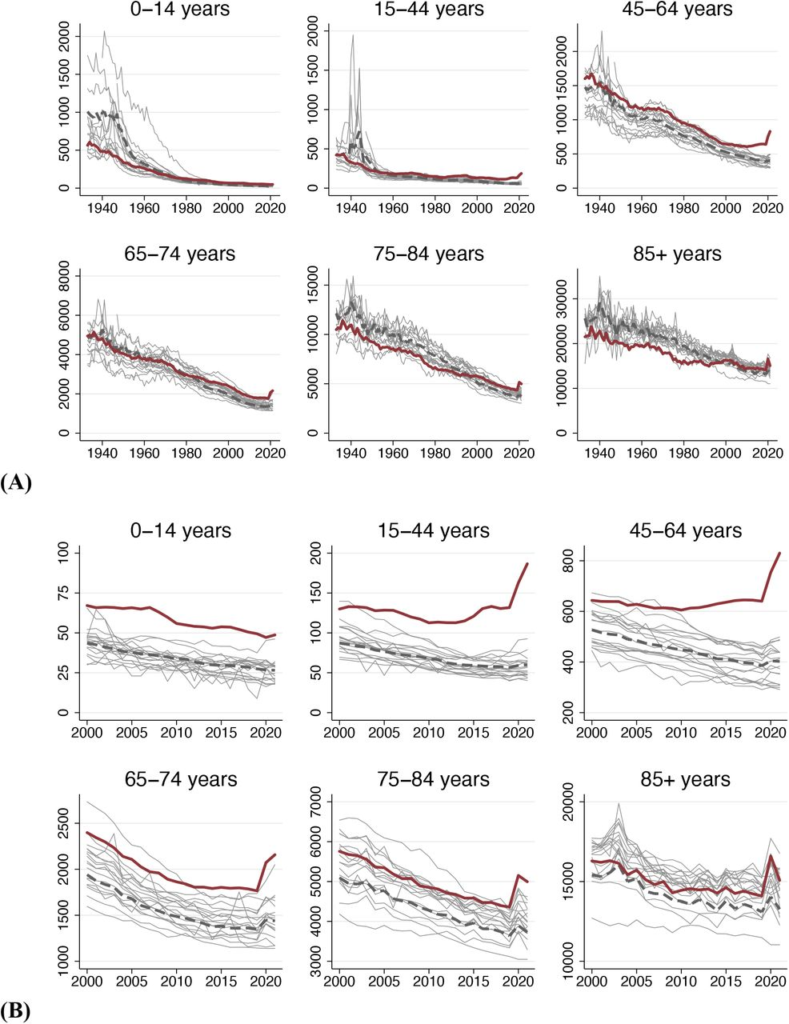
Age-specific mortality trends in the U.S. and other wealthy nations.Source: Human Mortality Database. Note: Figure shows deaths per 100K population, (A) 1933-2021 and (B) 2000-2021. Dark red line is U.S.; pink line is population-weighted average of other wealthy nations; grey lines are country-specific trends for other countries.

Excerpt:

We assessed how many U.S. deaths would have been averted each year, 1933-2021, if U.S. age-specific mortality rates had equaled those of other wealthy nations. The annual number of excess deaths in the U.S. increased steadily beginning in the late 1970s, reaching 626,353 in 2019. Excess deaths surged during the COVID-19 pandemic. In 2021, there were 1,092,293 “Missing Americans” and 25 million years of life lost due to excess mortality relative to peer nations. In 2021, half of all deaths under 65 years and 91% of the increase in under-65 mortality since 2019 would have been avoided if the U.S. had the mortality rates of its peers. Black and Native Americans made up a disproportionate share of Missing Americans, although the majority were White.

One sentence summary In 2021, 1.1 million U.S. deaths – including 1 in 2 deaths under age 65 years – would have been averted if the U.S. had the mortality rates of other wealthy nations.

Author(s):

Jacob Bor, View ORCID ProfileAndrew C. Stokes, Julia Raifman, Atheendar Venkataramani, Mary T. Bassett, David Himmelstein, Steffie Woolhandler


doi: https://doi.org/10.1101/2022.06.29.22277065

Publication Date: 30 Jun 2022

Publication Site: MedRXiV

Millennial Massacre Part 2: Increase In Mortality for Ages 18-39 for 2020-2021 Mainly Driven by Drug Overdoses and COVID

Link: https://marypatcampbell.substack.com/p/millennial-massacre-part-2-increase

Graphic:

Excerpt:

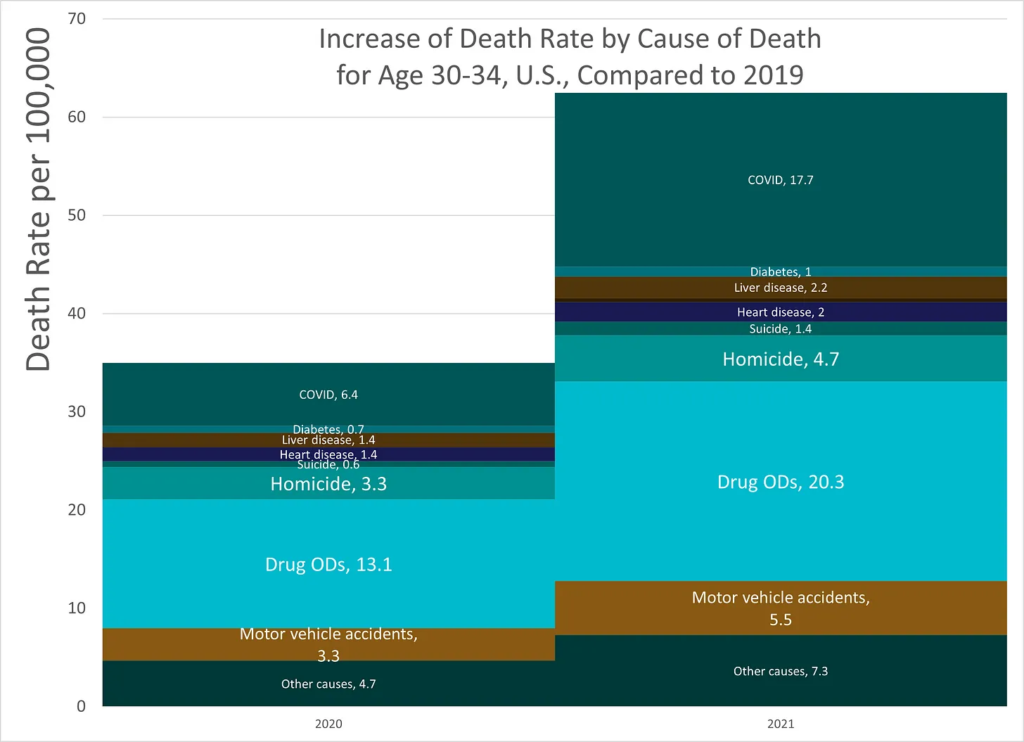
  • About 30% of the contribution to excess mortality for young adults in 2021 came from drug overdoses.
  • The percentage contribution to excess mortality of drug ODs was not that different by age group over the 18-39 age span.
  • COVID as a contribution to excess mortality was higher for older people —- for those age 35-39, 36% of their excess mortality came from COVID in 2021. In contrast, for those age 18-24, only 17% of their excess mortality came from COVID.
  • Indeed, the youngest of the adults (age 18-24) had higher contributions from homicide (20% of excess mortality) and had comparable excess mortality contribution from motor vehicle accidents (16%) in 2021.

Author(s): Mary Pat Campbell

Publication Date: 23 Jul 2022

Publication Site: STUMP at substack

As Pandemic Continues, More Older Adults Are Working — What’s Tempting Them?

Link: https://www.magnifymoney.com/news/working-older-adults-study/

Excerpt:

Amid the coronavirus pandemic, a rising share of adults 65 and older are working. In late April and early May 2020, 19.5% of Americans 65 and older were working. That figure jumped more than 2 percentage points in late April and early May 2022 to 21.9%. At the same time, the share of U.S. adults who reported that they’re retired is up similarly — from 14.9% in April and May 2020 to 17.4% in April and May 2022.

More than a quarter of working Americans 65 and older are self-employed. 25.6% of employed older Americans are self-employed — more than triple the rate among working Americans 25 to 39. Meanwhile, the government isn’t the landing spot it once was for older workers: In April and May 2020, 15.2% of employed Americans 65 and older worked for the government. In April and May 2022, however, that percentage plummeted by a third to 10.1%.

New Jersey saw the largest jump in older adults in the workforce since the beginning of the pandemic. In April and May 2020, 18.1% of Americans 65 and older were employed in New Jersey. By April and May 2022, that was up 18.9 percentage points to 37.0%. The other states with double-digit increases were West Virginia (17.2 percentage points) and Pennsylvania (14.6).

North Dakota saw the biggest dip in the percentage of adults 65 and older in the workforce. The rate of older working adults went from 36.0% in April and May 2020 to 25.0% in April and May 2022 — a drop of 11.0 percentage points. Other big drops were seen in Wisconsin (8.3 percentage points) and North Carolina (6.3).

Author(s): Alex Cook

Publication Date: 6 Jun 2022

Publication Site: Magnify Money

Childhood Mortality Trends, 1999-2021 (provisional), Ages 1-17

Link: https://marypatcampbell.substack.com/p/childhood-mortality-trends-1999-2021

Graphic:

Excerpt:

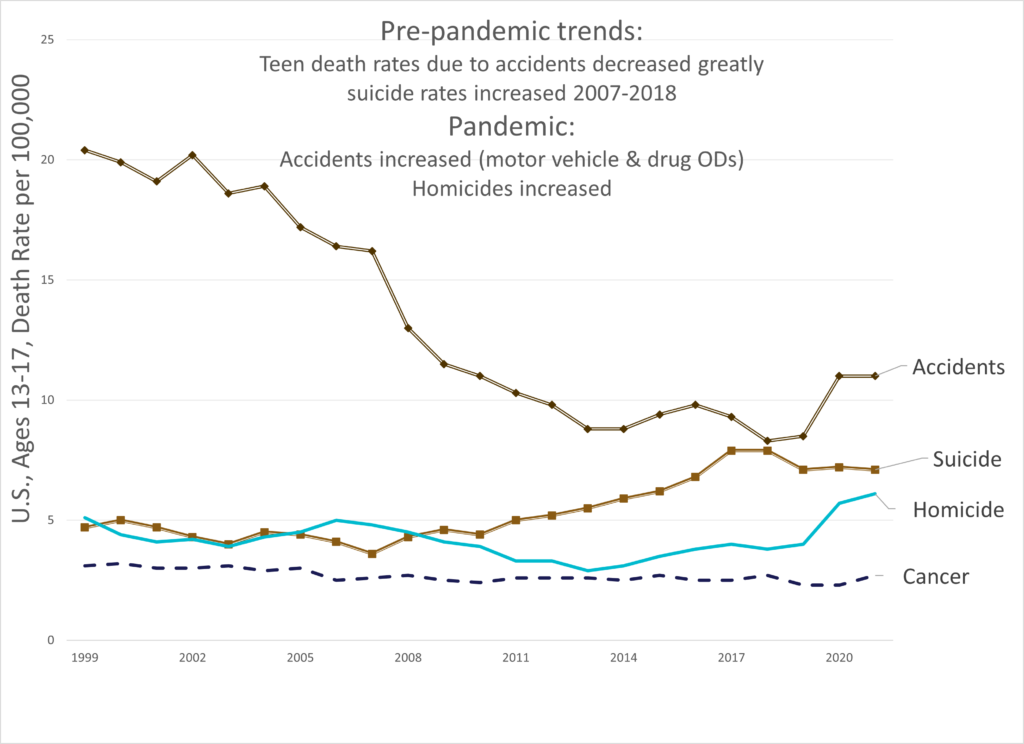
There was the good news from before the pandemic: the accidental death rate had come way, way down. That was mostly due to improved traffic safety. (Not reduced drug ODs, alas)

In the pandemic, both increased motor vehicle deaths and drug overdoses has pushed up the accidental death rate for teens to increase to levels seen a decade ago.

But there was a bad pre-pandemic trend: suicide rates had increased from 2007 to 2018 — increasing a total of 120% over that period. That was hideous.

It seemed to have reversed in 2019, and come down during the pandemic. The suicide trends in the pandemic really made no sense to anybody, but perhaps the increased drug ODs were actually suicides.

Homicides didn’t have a steady trend before the pandemic, but has definitely had a bad trend during the pandemic. Homicide death rates for teens increased over 50% from 2019 to 2021.

One observation: suicide and homicide death rates used to be about the same for teens in the early 2000s, and then with the bad suicide trend, suicide ranked higher. Even with the increase in homicide rates, suicide still ranks higher.

Author(s): Mary Pat Campbell

Publication Date: 15 June 2022

Publication Site: STUMP at substack

Current Causes of Death in Children and Adolescents in the United States

Link: https://www.nejm.org/doi/full/10.1056/NEJMc2201761

Graphic:

Excerpt:

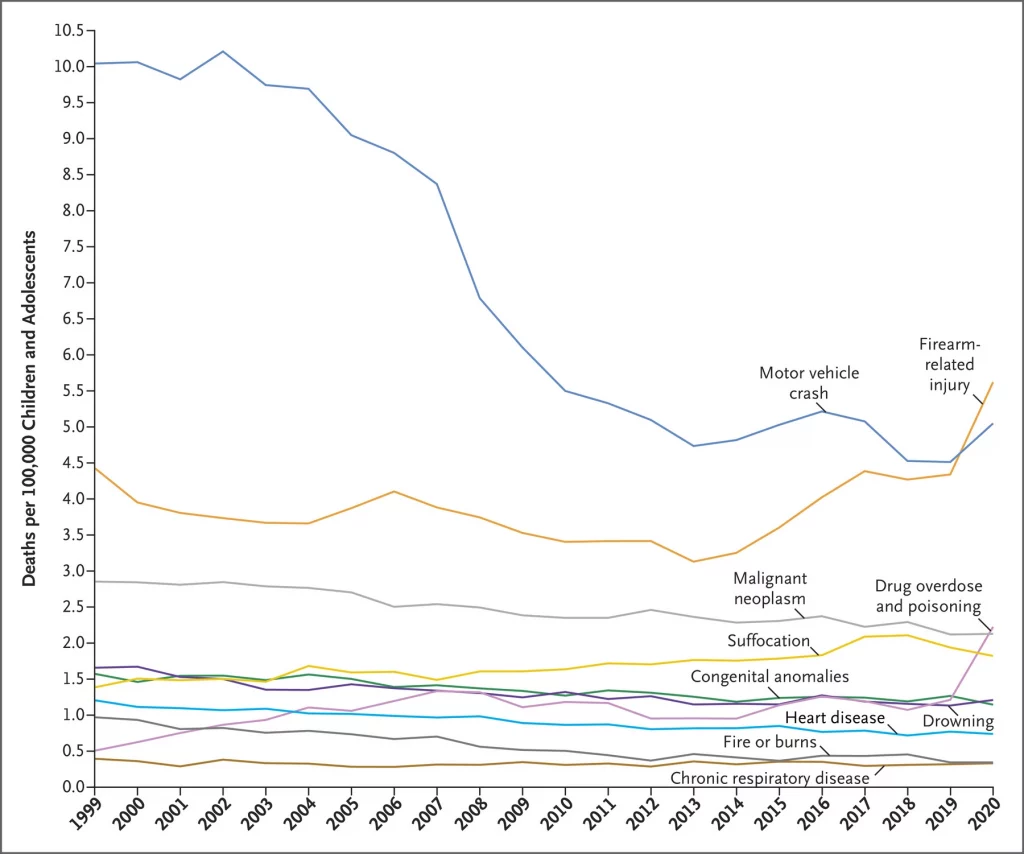
In addition, drug overdose and poisoning increased by 83.6% from 2019 to 2020 among children and adolescents, becoming the third leading cause of death in that age group. This change is largely explained by the 110.6% increase in unintentional poisonings from 2019 to 2020. The rates for other leading causes of death have remained relatively stable since the previous analysis, which suggests that changes in mortality trends among children and adolescents during the early Covid-19 pandemic were specific to firearm-related injuries and drug poisoning; Covid-19 itself resulted in 0.2 deaths per 100,000 children and adolescents in 2020.1

Although the new data are consistent with other evidence that firearm violence has increased during the Covid-19 pandemic,5 the reasons for the increase are unclear, and it cannot be assumed that firearm-related mortality will later revert to prepandemic levels. Regardless, the increasing firearm-related mortality reflects a longer-term trend and shows that we continue to fail to protect our youth from a preventable cause of death. Generational investments are being made in the prevention of firearm violence, including new funding opportunities from the CDC and the National Institutes of Health, and funding for the prevention of community violence has been proposed in federal infrastructure legislation. This funding momentum must be maintained.

Author(s):

Jason E. Goldstick, Ph.D.
Rebecca M. Cunningham, M.D.
Patrick M. Carter, M.D.
University of Michigan, Ann Arbor, MI

Publication Date: 19 May 2022

Publication Site: New England Journal of Medicine

Life Application Activity Cools Again

Link: https://www.thinkadvisor.com/2022/05/10/life-application-activity-cools-again/

Excerpt:

Policygenius, a life insurance web broker, uses its term life pricing information to provide monthly term life price index reports.

The company bases the index on prices for coverage with a 20-year-level premium term.

The lowest price shown is for coverage for a 25-year-old female nonsmoker who wants $250,000 in death benefits; The highest price is for a 55-year-old male smoker who wants $1 million in death benefits.

Policygenius figures suggest rising premiums may not be causing life application friction.

This month, the lowest price in the tables fell slightly, to $14.21, from $14.25 last month.

Author(s): Allison Bell

Publication Date: 10 May 2022

Publication Site: Think Advisor

U.S. Mortality Trends Through the Pandemic

Link: https://marypatcampbell.substack.com/p/us-mortality-trends-through-the-pandemic?s=w

Video:

Graphic:

Excerpt:

I discuss this in the portion of the talk about death rates by age group.

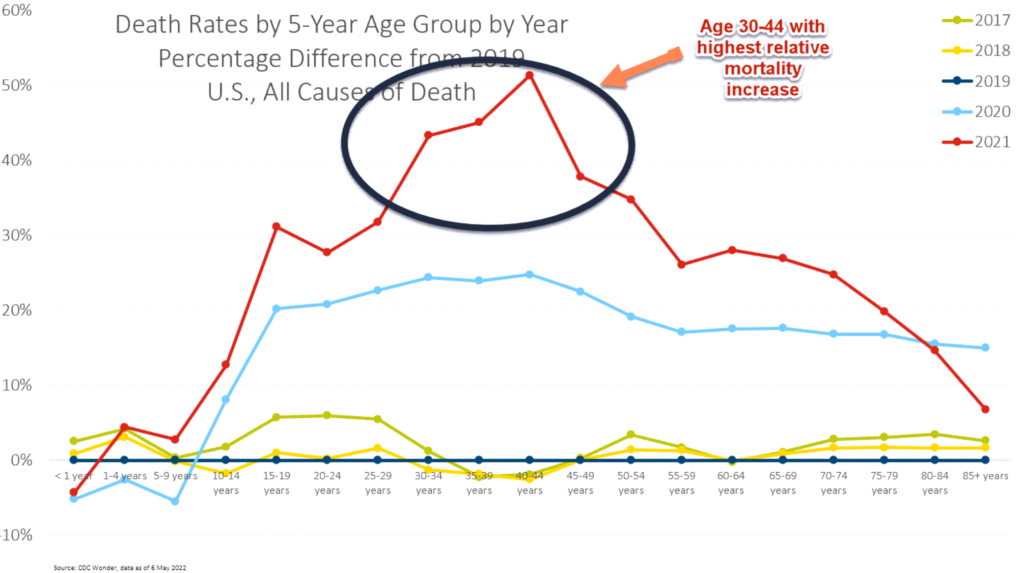
For 2021, the worst relative increase in mortality, compared to 2019, was for ages 30-44.

[I have called it the Millennial Massacre, but it obviously overlaps with Gen X…. and Middle Age Massacre doesn’t exactly work, either. Dang the allure of alliteration].

We will see in a moment that most of that mortality increase didn’t come from COVID.

If you look at overall mortality, obviously total mortality for this age group is much lower than for those much older.

A 5% increase in mortality for those aged 85+ will translate to a much larger number of deaths, but a 50% increase in mortality for those aged 40-44 is extremely worrisome to actuaries and insurers even if the absolute number of deaths is lower in impact. We’re setting reserves and expectations based on certain assumptions, and we’re generally not assuming fluctuations of 50% — that’s just nuts compared to our historical experience…..

…..until now.

Author(s): Mary Pat Campbell

Publication Date: 20 May 2022

Publication Site: STUMP on substack

All Men Must Die, But They Don’t Have to Die in Office

Link: https://marypatcampbell.substack.com/p/all-men-must-die-but-they-dont-have?s=w

Graphic:

Excerpt:

What’s interesting about the Senate age distribution is that though we have some difference in the lumpiness, when I look at the average age of the senators by party, they’re basically the same: 64 years old (and some change). On the younger end of the Boomers.

Author(s): Mary Pat Campbell

Publication Date: 29 April 2022

Publication Site: STUMP at substack