What to consider when using text in data visualizations

Link: https://blog.datawrapper.de/text-in-data-visualizations/

Graphic:

Excerpt:

Text is maybe the most underrated element in any data visualization. There’s a lot of text in any chart or map — titles, descriptions, notes, sources, bylines, logos, annotations, labels, color keys, tooltips, axis labels — but often, it’s an afterthought in the design process. This article explains how to use text to make your visualizations easier to read and nicer to look at.

Show information where readers need it
01 Label directly
02 Repeat the units your data is measured in
03 Remind people what they’re looking at in tooltips
04 Move the axis ticks where they’re needed
05 Emphasize and explain with annotations

Design for readability
06 Use a font that’s easy to read
07 Lead the eye with font sizes, styles, and colors
08 Limit the number of font sizes in your visualization
09 Don’t center-align your text
10 Don’t make your readers turn their heads
11 Use a text outline

Phrase for readability
12 Use straightforward phrasings
13 Be conversational first and precise later
14 Choose a suitable number format

Author(s): Lisa Charlotte Muth

Publication Date: 28 Sept 2022

Publication Site: Datawrapper

Three ways to make your charts more accessible

Link: https://flourish.studio/2021/03/01/accessible-chart-design/

Graphic:

Excerpt:

Where possible, use colors that are bold and clear enough for people to see both text and graphical elements, like lines and points. The Web Content Accessibility Guidelines (WCAG) suggest meeting the WCAG AA requirements – something that is required by law for public bodies in several countries.

To check if your color (and font size) choices are AA accessible you can use a contrast checker website. Here you can check if there is enough contrast between the foreground and background colour for someone with a certain level of impaired vision to be able to see your data or text.

Author(s): Lyndsey Pereira-Brereton, Luisa Bider

Publication Date: 1 March 2021

Publication Site: Flourish

Covid Vaccine Websites Violate Disability Laws, Create Inequity for the Blind

Excerpt:

In at least seven states, blind residents said they were unable to register for the vaccine through their state or local governments without help. Phone alternatives, when available, have been beset with their own issues, such as long hold times and not being available at all hours like websites.

Even the federal Centers for Disease Control and Prevention’s Vaccine Administration Management System, which a small number of states and counties opted to use after its rocky rollout, has been inaccessible for blind users.

Those problems violate the Rehabilitation Act of 1973, which established the right to communications in an accessible format, multiple legal experts and disability advocates said. The federal Americans with Disabilities Act, a civil rights law that prohibits governments and private businesses from discriminating based on disability, further enshrined this protection in 1990.

Author(s): Lauren Weber and Hannah Recht

Publication Date: 25 February 2021

Publication Site: Kaiser Health News

A Tableau Accessibility Journey – Part I

Link: https://www.datablick.com/blog/2021/2/4/a-tableau-accessibility-journey-part-i

Graphic:

Excerpt:

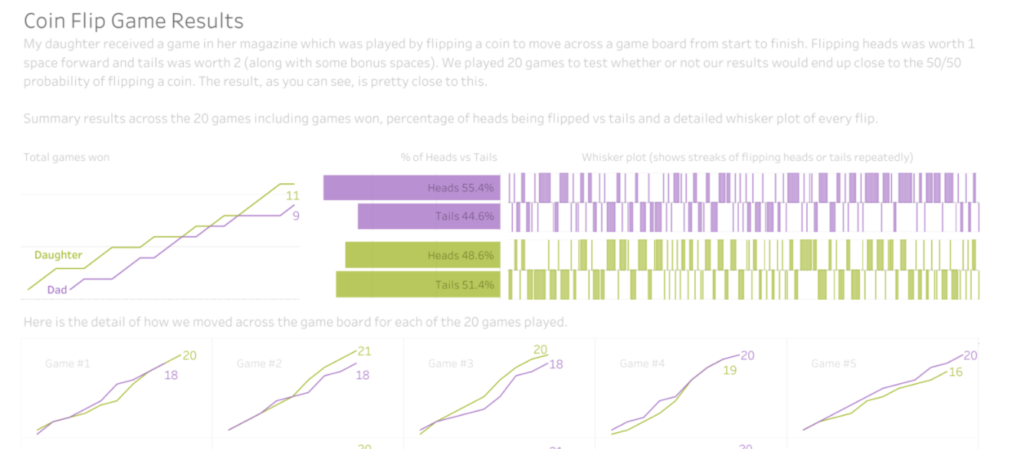
Recently, I came to the realization that 0 of my 58 published data visualizations on my Tableau Public profile provide equal access of their data and storylines for all users, mostly excluding those with disabilities. I have read and studied a lot about developing visuals with care for color blindness, but not so much for blindness itself, or low vision, or users who cannot use a mouse, or many other disabled users. A recent Twitter thread by our colleague Frank Elavsky hits on this topic. It is through these realizations that I decided to join and contribute to the dataviza11y group. A quick plug that we have a great group of people, looking to do some exciting things in this space, so do check out and follow that group and it’s member’s activities if you are interested. A wonderful and recent example is the talk Frank, Sarah Fossheim and Larene Le Gassick presented at Outlier.

Author(s): Chris DeMartini

Publication Date: 8 February 2021

Publication Site: Data Blick