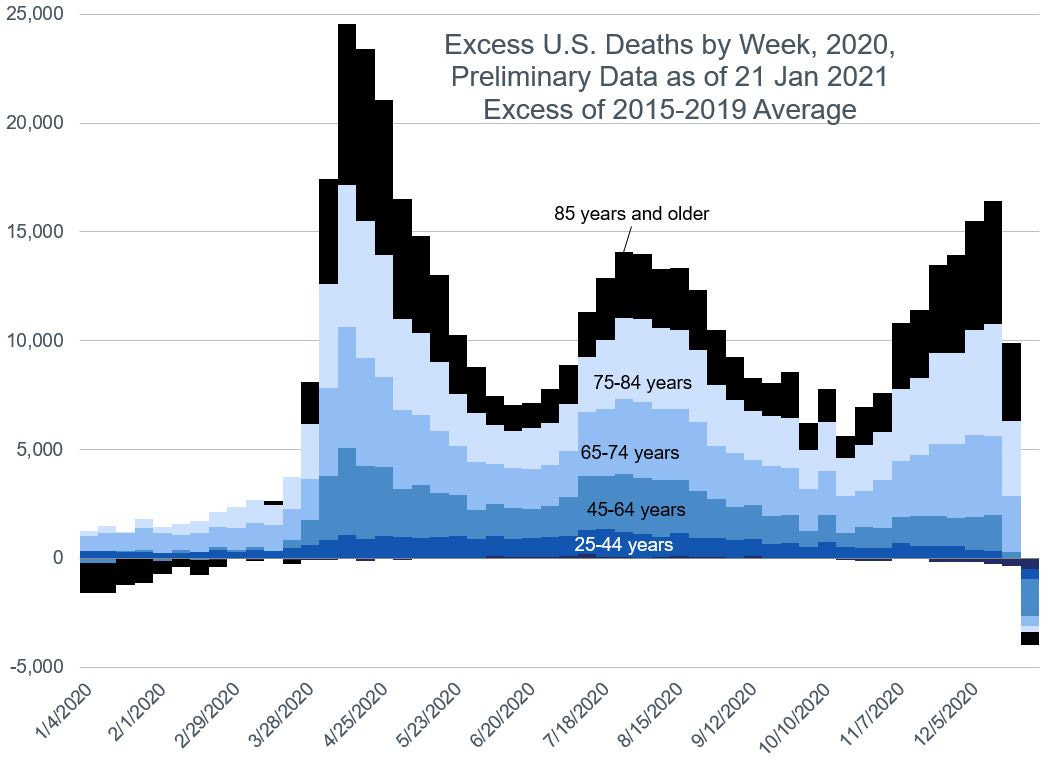
2020 Will End as One of America’s Most Violent Years in Decades

Link: https://time.com/5922082/2020-gun-violence-homicides-record-year/

Excerpt:

This year, many Americans have experienced significantly higher levels of violence both wrought on and within their communities. Gun violence and gun crime has, in particular, risen drastically, with over 19,000 people killed in shootings and firearm-related incidents in 2020. That’s the highest death toll in over 20 years, according to data from the Gun Violence Archive (GVA), an online site that collects gun violence data, and the Britannia Group’s non-partisan site procon.org.

This total includes victims of homicides and unintentional deaths but does not include gun suicides. And despite there being no “large-scale” shootings in 2020, the number of mass shootings—which are classified as an incident in which four or more people are shot and injured or killed—has actually risen, drastically, to over 600, the most in the past 5 years and a nearly 50% increase in 2019’s total.

Author(s): Josiah Bates

Publication Date: 30 December 2020

Publication Site: Time

Despite Covid-19 and stay-at-home orders, 2020 saw an increase in homicides across the US

Link: https://www.cnn.com/2021/01/01/us/homicides-2020-increase-coronavirus/index.html

Graph:

Excerpt:

Despite less activity outside with the closing of businesses and schools, 2020 saw a dramatic increase in homicides.

Between January and October, there was a 29% increase in homicides compared to the same timeframe in 2019, according to a November report from the National Commission on Covid-19 and Criminal Justice. As of December 27, some of America’s largest cities saw dramatic increases as well, including Chicago (55%), New York (41%) and Los Angeles (30%).

Author(s): Amir Vera

Publication Date: 1 January 2021

Publication Site: CNN

Update to Special Reports on Traffic Safety During the COVID-19 Public Health Emergency: Third Quarter Data

Link: https://www.nhtsa.gov/sites/nhtsa.dot.gov/files/documents/traffic_safety_during_covid19_01062021_0.pdf

Graph:

Excerpt:

To a large extent, the risky traffic safety behaviors observed in Q2 continued in Q3. Frequency of triptaking continued to be lower, and a greater percentage of people stayed home in Q3 2020 compared to Q\3 2019. Ejection rates remained elevated compared to the same period a year earlier. New data on seat belt use among seriously injured drivers and passengers suggests that the belt use rate among those in serious crashes decreased in the early phases of the public health emergency at the study sites, but that rate may now be rebounding. The data also suggested that alcohol- and other drug-positive drivers and passengers who were seriously or fatally injured were much less likely to wear a seat belt than their counterparts who tested negative for all the drugs included in the study.

Speed data from the NPMRDS shows higher speeds in urban roadways across roadway types in Q3 2020 compared to the same period in 2019. Further, the greater speed dispersion in rural areas observed in Q2 continued in Q3 2020 compared to the same period in 2019.

Regarding alcohol and other drug prevalence among seriously and fatally injured drivers at the five trauma center study sites, more than 29% in the most recent period (July 19 to September 30) had measurable alcohol in their systems, with over 26% testing positive for the presence of cannabinoids and over 13% positive for opioids. In the same period, the percentage of drivers testing positive for at least one category of drugs remained above 60%, with nearly 25% testing positive for multiple
categories of drugs. These observed increases in alcohol and other drug prevalence relative to before the public health emergency are consistent with the reported data that showed increases in marijuana and alcohol sales and consumption during the public health emergency. Overall, these data sets continue to have great potential to improve our understanding of the prevalence of drugs and alcohol among different types of seriously and fatally injured road users, as well as how prevalence may be changing over time during the public health emergency.

Author(s): Office of Behavioral Safety Research

Publication Date: January 2021

Publication Site: NHTSA

World Mortality Data Set

Link: https://github.com/akarlinsky/world_mortality

Additional Link: https://github.com/dkobak/excess-mortality

Paper: https://www.medrxiv.org/content/10.1101/2021.01.27.21250604v1

Graph:

Abstract:

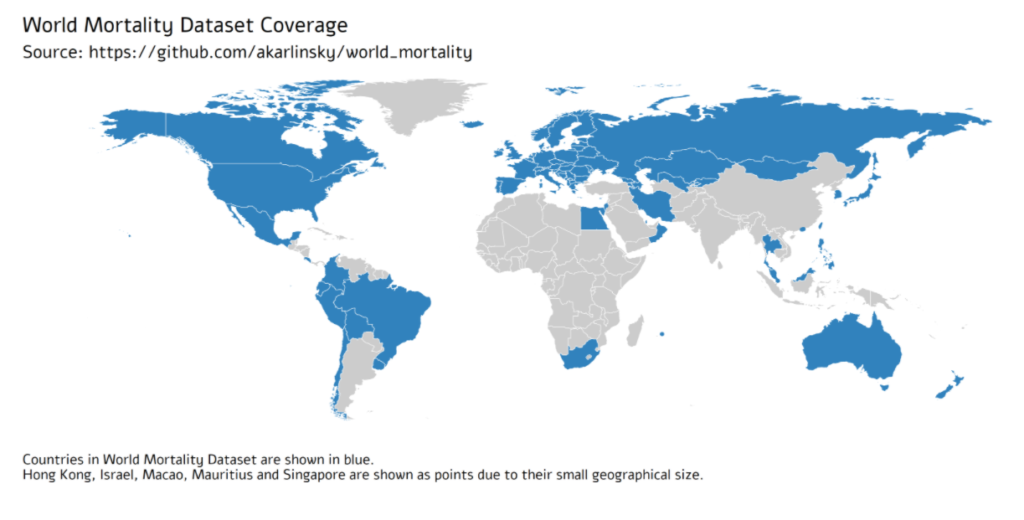
Comparing the impact of the COVID-19 pandemic between countries or across time is difficult because the reported numbers of cases and deaths can be strongly affected by testing capacity and reporting policy. Excess mortality, defined as the increase in all-cause mortality relative to the recent average, is widely considered as a more objective indicator of the COVID-19 death toll. However, there has been no central, frequently-updated repository of the all-cause mortality data across countries. To fill this gap, we have collected weekly, monthly, or quarterly all-cause mortality data from 77 countries, openly available as the regularly-updated World Mortality Dataset. We used this dataset to compute the excess mortality in each country during the COVID-19 pandemic. We found that in the worst-affected countries the annual mortality increased by over 50%, while in several other countries it decreased by over 5%, presumably due to lockdown measures decreasing the non-COVID mortality. Moreover, we found that while some countries have been reporting the COVID-19 deaths very accurately, many countries have been underreporting their COVID-19 deaths by an order of magnitude or more. Averaging across the entire dataset suggests that the world’s COVID-19 death toll may be at least 1.6 times higher than the reported number of confirmed deaths.

Authors: Ariel Karlinsky, Dmitry Kobak

Date Accessed: 3 February 2021

Publication Date: 29 January 2021

Publication Site: github

Mortality with Meep: Excess Mortality in California, Texas, and Florida by Race/Ethnicity

Link: https://marypatcampbell.substack.com/p/mortality-with-meep-excess-mortality-8e2

Excerpt:

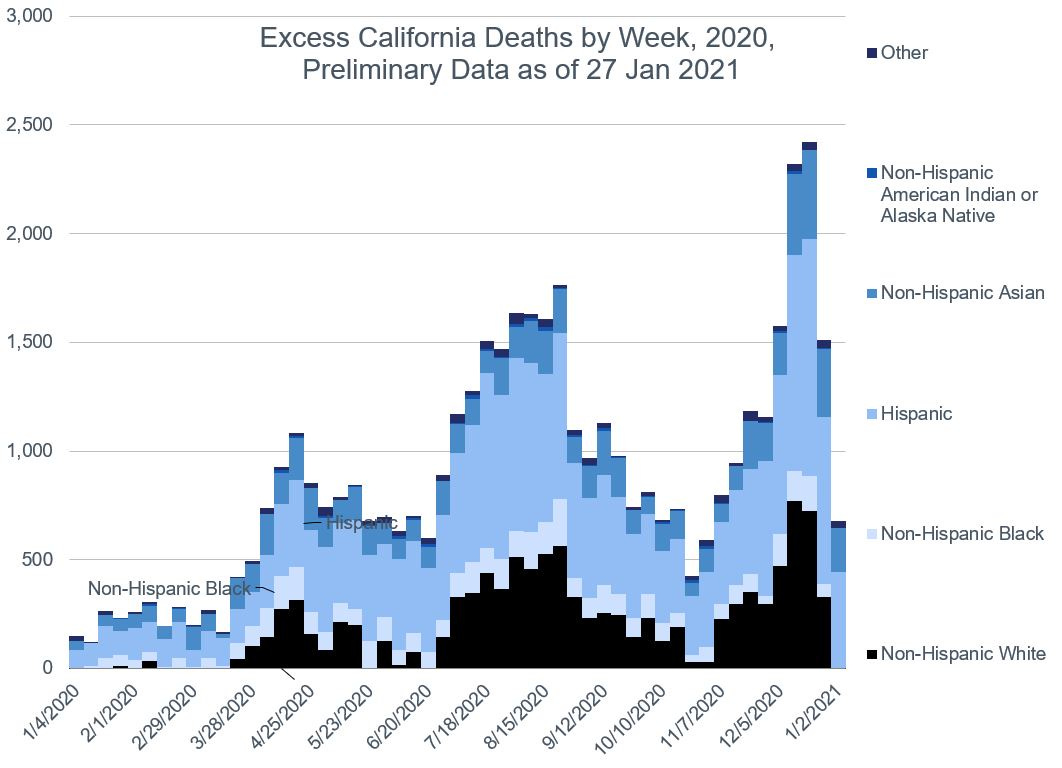
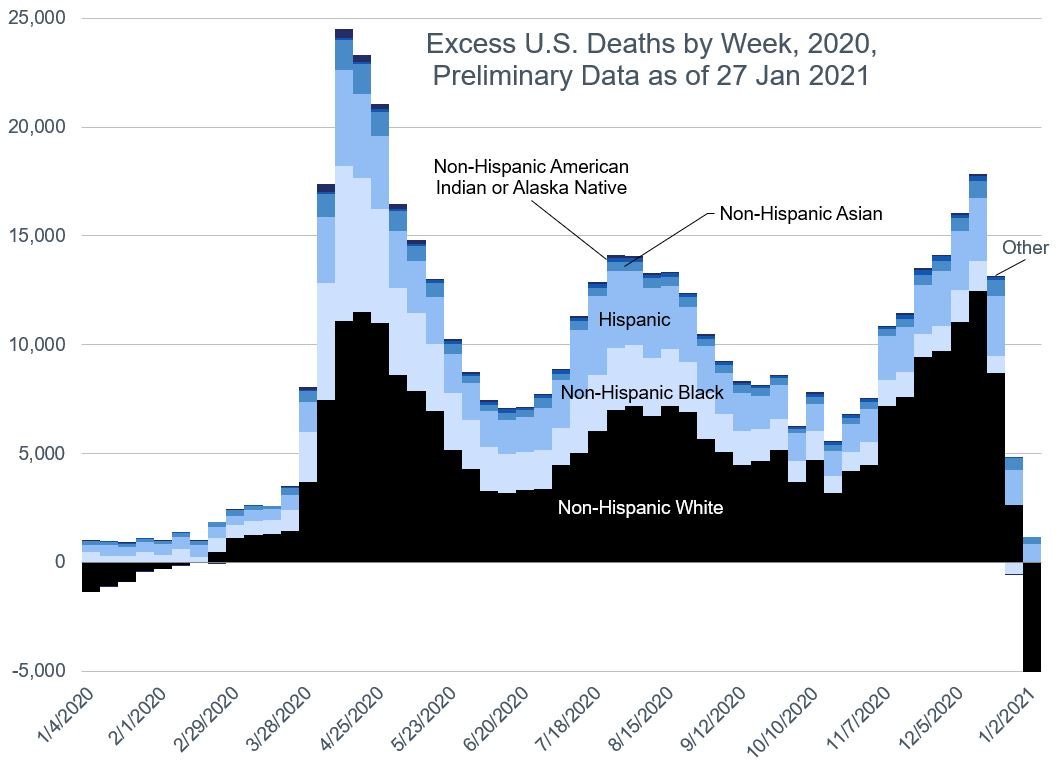
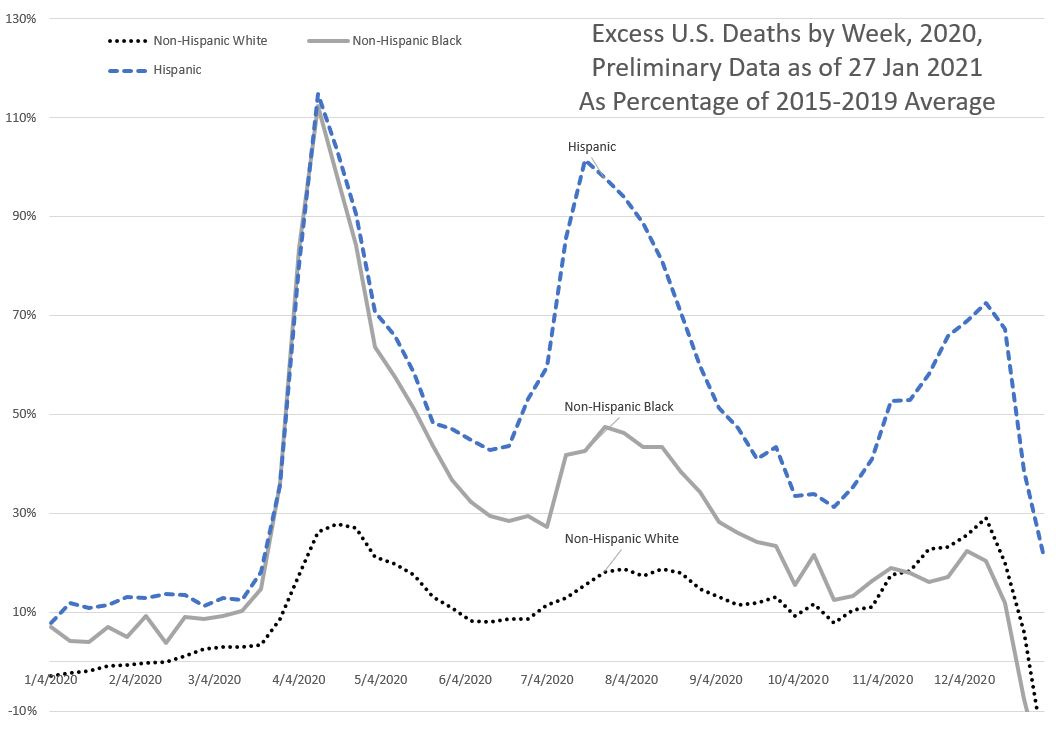
For Hispanics, it’s two thirds, with most of it coming from California (23%), then Texas (21%), then Florida (10%). New York City accounts for 9%, and then the rest of New York state for 3%.

UPDATE: Checking out the Hispanic population by state, these percentages are a little in line with national distribution — California (26% of U.S. Hispanic population), Texas (19%), Florida (9%), New York (including NYC — 6%). The most disproportionate effect comes from New York City.

Graph:

Author: Mary Pat Campbell

Publication Date: 31 January 2021

Publication Site: STUMP

Census Estimates Show Population Decline in 16 States

Link: https://www.pewtrusts.org/en/research-and-analysis/blogs/stateline/2021/01/21/census-estimates-show-population-decline-in-16-states

Excerpt:

With a perfect storm of aging residents, low birth rates, COVID-19 deaths and immigration cutbacks, 16 states saw population decreases last year as the United States experienced the slowest national population growth since the Great Depression.

The nation grew only about 7% between 2010 and 2020, similar to the previous historic low between 1930 and 1940, according to new Census Bureau estimates, which do not reflect the 2020 census counts. The agency will release the final 2020 census tally in March.

Author: Tim Henderson

Publication Date: 21 January 2021

Publication Site: Pew

The rise in murders in the US, explained

Link: https://www.vox.com/2020/8/3/21334149/murders-crime-shootings-protests-riots-trump-biden

Excerpt:

A new report, by the Council on Criminal Justice, found homicides have increased sharply this year across 21 US cities with relevant data: “Homicide rates increased by 42% during the summer and 34% in the fall over the summer and fall of 2019.” Other data, from crime analyst Jeff Asher, found murder is up 36 percent throughout the year so far, compared to the same period in 2019, in a sample of 51 US cities. A preliminary FBI report also found murders up 15 percent nationwide in the first half of 2020.

Author: German Lopez

Publication Date: 2 December 2020

Publication Site: Vox

Excess Deaths Associated with COVID-19

Link: https://www.cdc.gov/nchs/nvss/vsrr/covid19/excess_deaths.htm

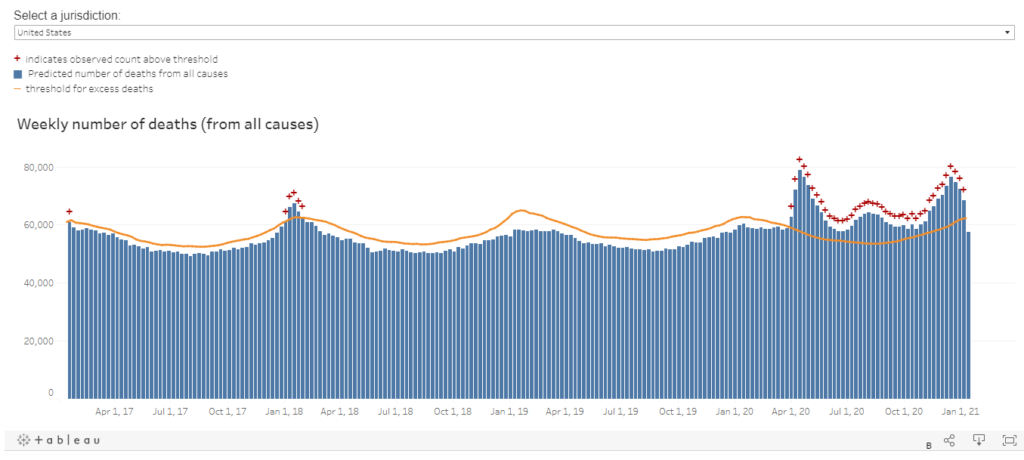
Description: Tableau dashboards from the CDC showing weekly updated data, with the following dashboards:

Weekly Excess Deaths
 Excess deaths with and without COVID-19
 Excess deaths with and without weighting
 Number of Excess Deaths
 Percent Excess Deaths
 Weekly Number of Deaths by Age
 Weekly Number of Deaths by Race/Ethnicity
 Change in Number of Deaths by Race/Ethnicity
 Weekly Number of Deaths by Cause Group
 Weekly Number of Deaths by Cause Subgroup
 Change in the Number of Deaths by Cause
 Total number above average by cause
 Total number above average by jurisdiction/cause

Also, downloadable data.

Example from 24 January 2021:

Data last updated: 21 January 2021

Regularly updated on Wednesdays, usually

Publication Site: CDC