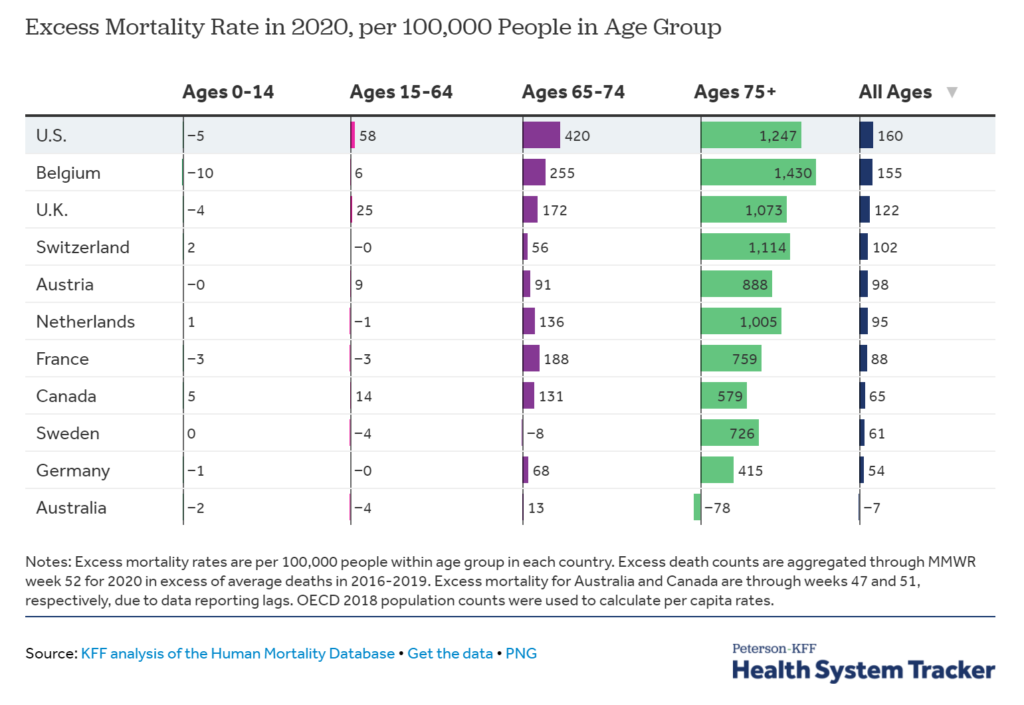
Between March 1, 2020, and January 2, 2021, the US experienced 2 801 439 deaths, 22.9% more than expected, representing 522 368 excess deaths (Table). The excess death rate was higher among non-Hispanic Black (208.4 deaths per 100 000) than non-Hispanic White or Hispanic populations (157.0 and 139.8 deaths per 100 000, respectively); these groups accounted for 16.9%, 61.1%, and 16.7% of excess deaths, respectively. The US experienced 4 surge patterns: in New England and the Northeast, excess deaths surged in the spring; in the Southeast and Southwest, in the summer and early winter; in the Plains, Rocky Mountain, and far West, primarily in early winter; and in the Great Lakes, bimodally, in the spring and early winter (Figure). Excess deaths were increasing in all regions at the end of 2020. The 10 states with the highest per capita rate of excess deaths were Mississippi, New Jersey, New York, Arizona, Alabama, Louisiana, South Dakota, New Mexico, North Dakota, and Ohio. New York experienced the largest relative increase in all-cause mortality (38.1%). Deaths attributed to COVID-19 accounted for 72.4% of US excess deaths.
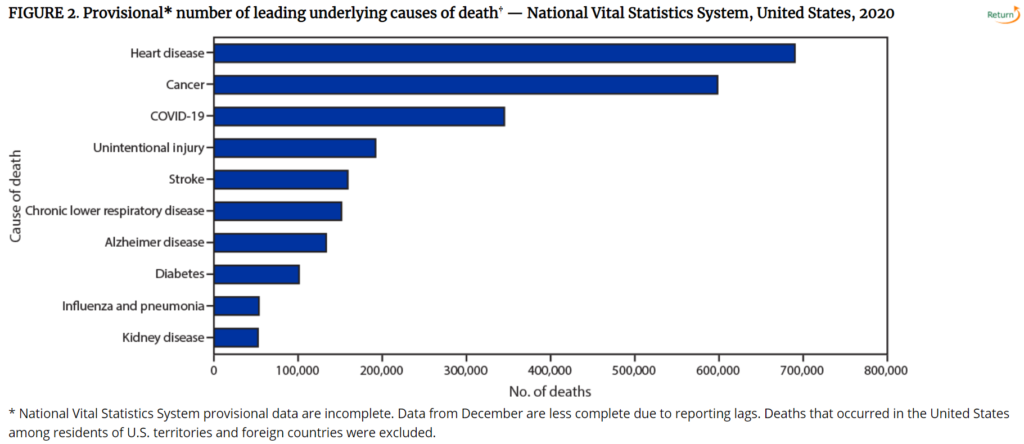
Joinpoint analyses revealed an increase in weekly mortality from non–COVID-19 causes, including heart disease from March 15 to April 11, 2020 (APC, 4.9 [95% CI, 0.7-9.3]), and October 11, 2020, to January 2, 2021 (APC, 1.1 [95% CI, 0.8-1.4]); Alzheimer disease/dementia from March 15 to April 11, 2020 (APC, 7.1 [95% CI, 2.4-12.0]), May 31 to August 15, 2020 (APC, 1.2 [95% CI, 0.7-1.6]), and September 6, 2020, to January 2, 2021 (APC, 1.3 [95% CI, 1.1-1.5]); and diabetes from March 8 to April 11, 2020 (APC, 6.5 [95% CI, 2.8-10.3]), May 31 to July 11, 2020 (APC, 2.6 [95% CI, 0.2-5.0]), and October 18, 2020, to January 2, 2021 (APC, 2.2 [95% CI, 1.6-2.8]).


