Characteristics of US Blood Donors Testing Reactive for Antibodies to SARS-CoV-2 Prior to the Availability of Authorized Vaccines

Link: https://pubmed.ncbi.nlm.nih.gov/34373145/

Graphic:
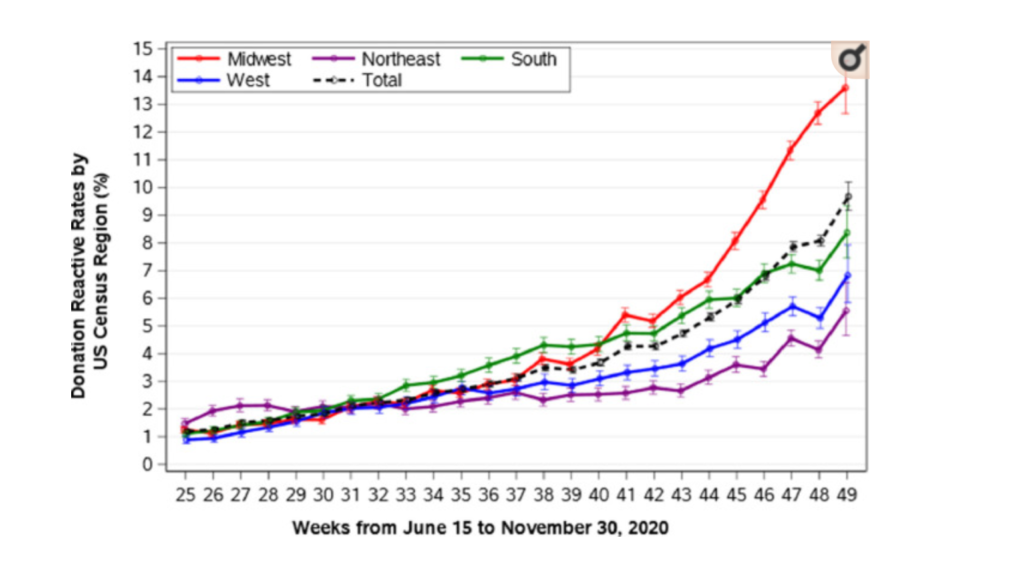
Abstract:

In the United States, many blood collection organizations initiated programs to test all blood donors for antibodies to SARS-CoV-2, as a measure to increase donations and to assist in the identification of potential donors of COVID-19 convalescent plasma (CCP). As a result, it was possible to investigate the characteristics of healthy blood donors who had previously been infected with SARS-CoV-2. We report the findings from all blood donations collected by the American Red Cross, representing 40% of the national blood supply covering 44 States, in order to characterize the seroepidemiology of SARS-CoV-2 infection among blood donors in the United States, prior to authorized vaccine availability. We performed an observational cohort study from June 15th to November 30th, 2020 on a population of 1.531 million blood donors tested for antibodies to the S1 spike antigen of SARS-CoV-2 by person, place, time, ABO group and dynamics of test reactivity, with additional information from a survey of a subset of those with reactive test results. The overall seroreactivity was 4.22% increasing from 1.18 to 9.67% (June 2020 – November 2020); estimated incidence was 11.6 per hundred person-years, 1.86-times higher than that based upon reported cases in the general population over the same period. In multivariable analyses, seroreactivity was highest in the Midwest (5.21%), followed by the South (4.43%), West (3.43%) and Northeast (2.90%). Seroreactivity was highest among donors aged 18-24 (Odds Ratio 3.02 [95% Confidence Interval 2.80-3.26] vs age >55), African-Americans and Hispanics (1.50 [1.24-1.80] and 2.12 [1.89-2.36], respectively, vs Caucasian). Group O frequency was 51.5% among nonreactive, but 46.1% among seroreactive donors (P< .0001). Of surveyed donors, 45% reported no COVID-19-related symptoms, but 73% among those unaware of testing. Signal levels of antibody tests were stable over 120 days or more and there was little evidence of reinfection. Evaluation of a large population of healthy, voluntary blood donors provided evidence of widespread and increasing SARS-CoV-2 seroprevalence and demonstrated that at least 45% of those previously infected were asymptomatic. Epidemiologic findings were similar to those among clinically reported cases.

Author(s): Roger Y Dodd, Bryan R Spencer, Meng Xu 1, Gregory A Foster 1, Paula Saá 1, Jaye P Brodsky 2, Susan L Stramer 3

Publication Date: 18 August 2021

Publication Site: National Library of Medicine
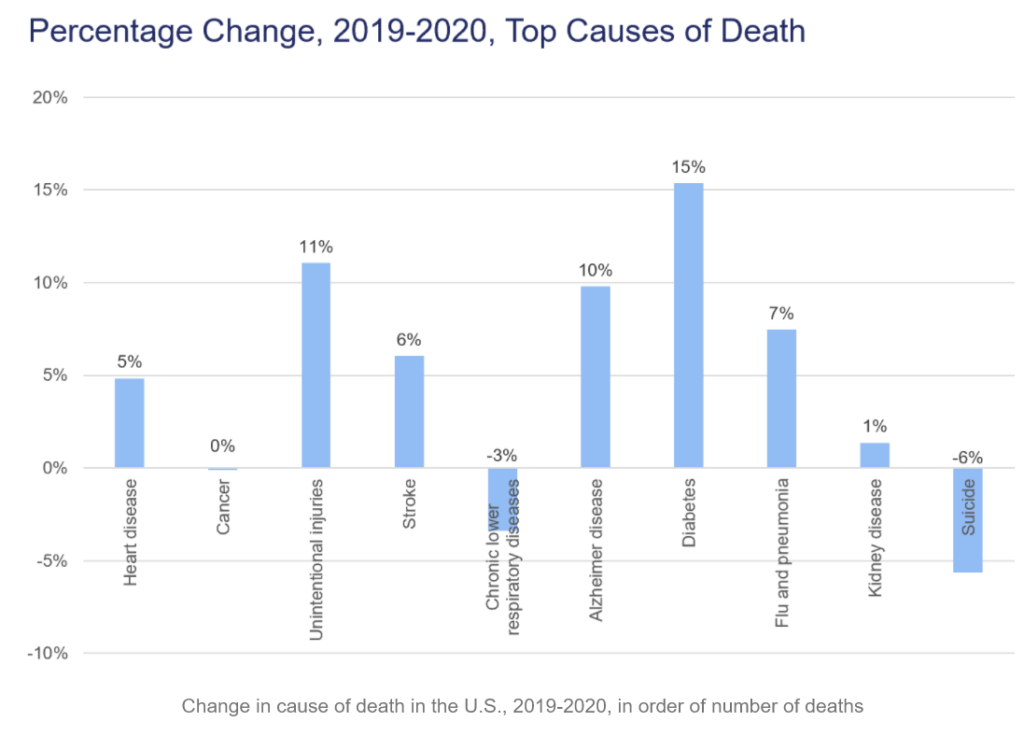
Mortality with Meep: Cause of Death Trend — Heart Disease — 1999-2020

Link: https://marypatcampbell.substack.com/p/mortality-with-meep-cause-of-death

Video:

Graphic:

Excerpt:

The long-term trend has been improvement for this cause of death, with it most obvious for the oldest age groups. This trend has been driven by improvement in medical treatment for the condition, but also due to the decrease in smoking rates… decades ago. Some causes of death have behavior that precedes the death by decades, which can get tricky to track for our top two causes of death: heart disease and cancer. Even so, smoking cigarettes has been a huge driver for both these causes, and made a large differentiator by sex and smoking status for a long time.

Author(s): Mary Pat Campbell

Publication Date: 26 July 2021

Publication Site: STUMP at substack

Mortality with Meep: Huge Increase in Death by Drug Overdose in 2020

Link: https://marypatcampbell.substack.com/p/mortality-with-meep-huge-increase

Graphic:

Excerpt:

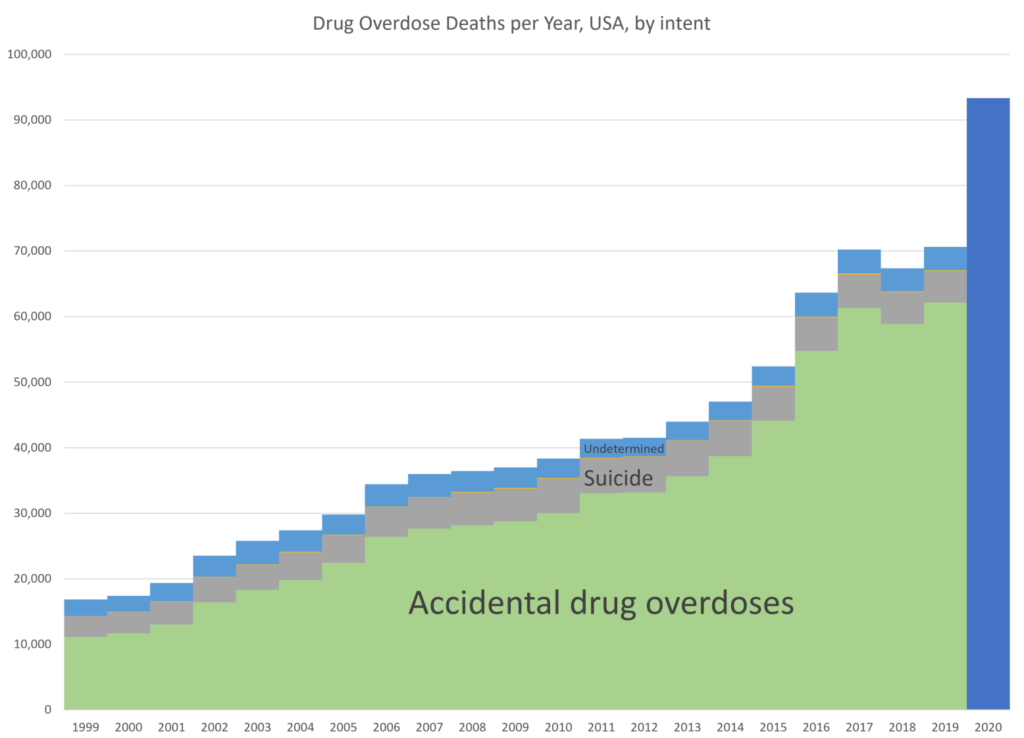
In 2020, there were over 93K deaths due to drug overdoses — a 30% increase over 2019.

This is super-bad, and worse than what I have seen for increases in other causes of death. I knew it was going to be bad, but I didn’t realize it was going to be this bad.

Author(s): Mary Pat Campbell

Publication Date: 14 July 2021

Publication Site: STUMP at substack

Update to Special Reports on Traffic Safety During the COVID-19 Public Health Emergency: Fourth Quarter Data

Link: https://www.nhtsa.gov/sites/nhtsa.gov/files/2021-06/Update_Traffic%20Safety%20During%20COVID-19_4thQtr-060121-web.pdf

Graphic:

Excerpt:

The NEMSIS data include metrics on crash severity. For people treated at the scenes of motor vehicle crashes, EMS professionals use an injury scoring system called the Revised Trauma Score (RTS) to determine the level of care needed to save the lives of the injured. Under
RTS, patients who present with a probability of survival of 36.1% or less are considered severely injured and are often transported to Level 1 or Level 2 trauma centers that provide higher levels of critical care to the most severely injured. Figure 4 shows the percentage of
patients in crashes whose probability of survival was in this range for 2019 and 2020. Beginning in Week 12 of 2020, the percentage of those injured with a probability of survival of 36.1% or less never dropped below 1%, suggesting an increase in the severity of crashes.

Publication Date: June 2021

Publication Site: NHTSA

Early Estimates of Motor Vehicle Traffic Fatalities and Fatality Rate by Sub-Categories in 2020

Link: https://crashstats.nhtsa.dot.gov/Api/Public/ViewPublication/813118

Graphic:

Excerpt:

Total fatality rate per 100 million VMT [vehicle miles traveled] is broken down by roadway function class: rural versus urban interstate, arterial, local/collector/street. The results shown in Figure 2 indicate that the increased trend of the total fatality rate per 100 million VMT from March to December 2020, was mainly driven by the fatality rate per 100 million VMT on the rural local/collector/street, rural and urban arterial roadways.

Publication Date: May 2021

Publication Site: NHTSA

Deaths of despair and the incidence of excess mortality in 2020

Link: https://voxeu.org/article/deaths-despair-and-incidence-excess-mortality-2020

Graphic:

Excerpt:

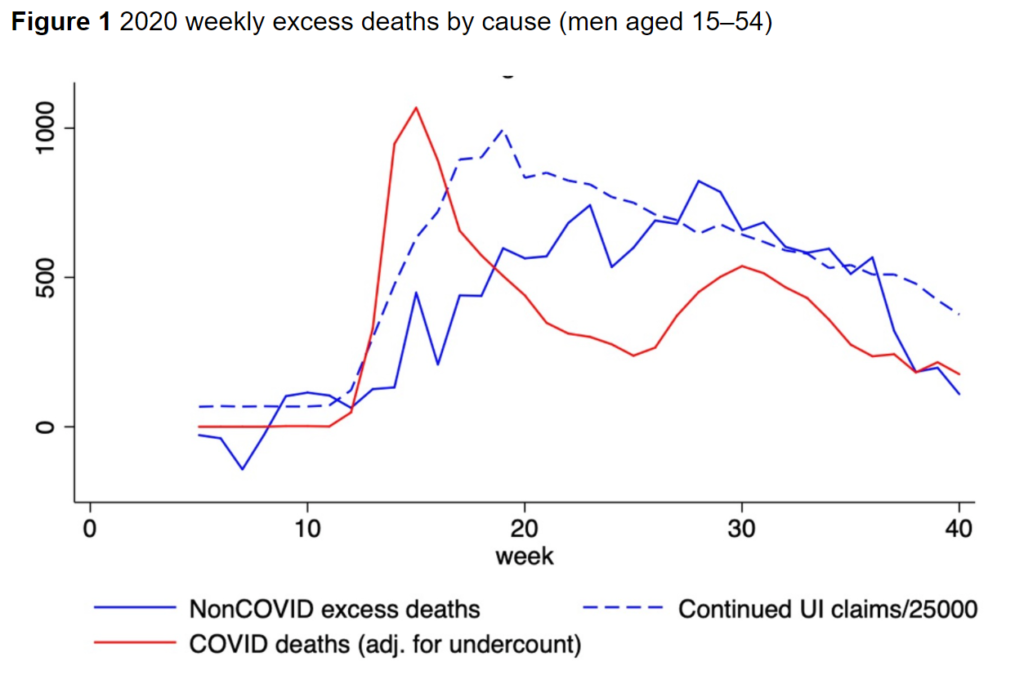
Mortality in 2020 significantly exceeds what would have occurred if official COVID-19 deaths were combined with a normal number of deaths from other causes. The demographic and time patterns of the non-COVID-19 excess deaths (NCEDs) point to deaths of despair rather than an undercount of COVID-19 deaths. The flow of NCEDs increased steadily from March to June and then plateaued. They were disproportionately experienced by working-age men, including men as young as 15 to 24. The chart below, reproduced from Mulligan (2020b), shows these results for men aged 15–54. To compare the weekly timing of their excess deaths to a weekly measure of economic conditions, Figure 1 also includes continued state unemployment claims scaled by a factor of 25,000, shown together with deaths.

Author(s): Casey Mulligan

Publication Date: 28 January 2021

Publication Site: Vox EU

Association of State-Issued Mask Mandates and Allowing On-Premises Restaurant Dining with County-Level COVID-19 Case and Death Growth Rates — United States, March 1–December 31, 2020

Link: https://www.cdc.gov/mmwr/volumes/70/wr/mm7010e3.htm?fbclid=IwAR3O5YrbN3joxCwg8trS8gLSXanQAGhCzfVG8rw0ajeatZXIoNcQRVdrmOE

Graphic:

Excerpt:

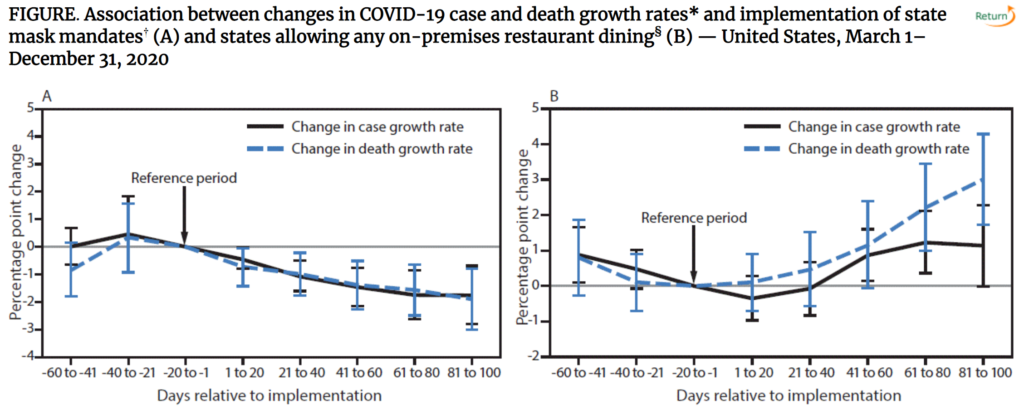
During March 1–December 31, 2020, state-issued mask mandates applied in 2,313 (73.6%) of the 3,142 U.S. counties. Mask mandates were associated with a 0.5 percentage point decrease (p = 0.02) in daily COVID-19 case growth rates 1–20 days after implementation and decreases of 1.1, 1.5, 1.7, and 1.8 percentage points 21–40, 41–60, 61–80, and 81–100 days, respectively, after implementation (p<0.01 for all) (Table 1) (Figure). Mask mandates were associated with a 0.7 percentage point decrease (p = 0.03) in daily COVID-19 death growth rates 1–20 days after implementation and decreases of 1.0, 1.4, 1.6, and 1.9 percentage points 21–40, 41–60, 61–80, and 81–100 days, respectively, after implementation (p<0.01 for all). Daily case and death growth rates before implementation of mask mandates were not statistically different from the reference period.

Author(s): Gery P. Guy Jr., PhD1; Florence C. Lee, MPH1; Gregory Sunshine, JD1; Russell McCord, JD1; Mara Howard-Williams, JD2; Lyudmyla Kompaniyets, PhD1; Christopher Dunphy, PhD1; Maxim Gakh, JD3; Regen Weber1; Erin Sauber-Schatz, PhD1; John D. Omura, MD1; Greta M. Massetti, PhD1; CDC COVID-19 Response Team, Mitigation Policy Analysis Unit; CDC Public Health Law Program

Publication Date: 12 March 2021

Publication Site: CDC

Mortality with Meep: On Excess non-COVID Mortality in 2020

Link: https://marypatcampbell.substack.com/p/mortality-with-meep-on-excess-non

Graphic:

Excerpt:

All of the excess mortality for age 85+ can be explained by COVID, essentially

Very little of the excess mortality for those age 15-24 can be explained by COVID

There is a lot of excess mortality for those age 25-44 not explained by COVID

Author(s): Mary Pat Campbell

Publication Date: 22 May 2021

Publication Site: STUMP at substack

Motor Vehicle Deaths in 2020 Estimated to be Highest in 13 Years, Despite Dramatic Drops in Miles Driven

Link: https://www.nsc.org/newsroom/motor-vehicle-deaths-2020-estimated-to-be-highest

Excerpt:

For the first time since 2007, preliminary data from the National Safety Council show that as many as 42,060 people are estimated to have died in motor vehicle crashes in 2020. That marks an 8% increase over 2019 in a year where people drove significantly less frequently because of the pandemic. The preliminary estimated rate of death on the roads last year spiked 24% over the previous 12-month period, despite miles driven dropping 13%. The increase in the rate of death is the highest estimated year-over-year jump that NSC has calculated since 1924 – 96 years. It underscores the nation’s persistent failure to prioritize safety on the roads, which became emptier but far more deadly.  

An estimated 4.8 million additional roadway users were seriously injured in crashes in 2020, and the estimated cost to society was $474 billion. With the alarming picture painted by these data, NSC is urging President Joe Biden and Transportation Secretary Pete Buttigieg to commit to zero roadway deaths by 2050 – a call NSC and more than 1,500 other organizations and individuals made in January in a letter to the new administration. 

Publication Date: 4 March 2021

Publication Site: National Safety Council

Mortality with Meep: Location of Death Data for 1999-2020, Entire United States

Link: https://marypatcampbell.substack.com/p/mortality-with-meep-looking-at-location

Graphic:

Excerpt:

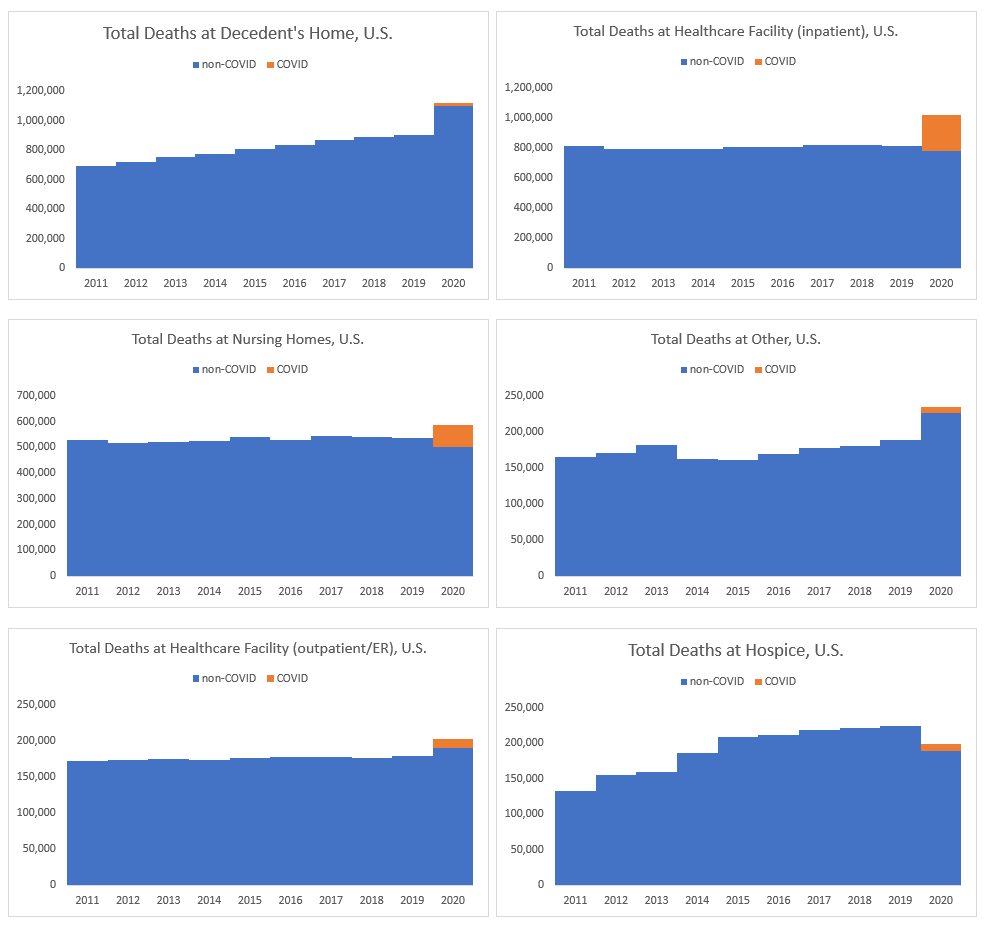
For a few locations, it’s pretty clear that COVID explains almost all their excess deaths: inpatient healthcare facilities and nursing homes. Indeed, it looks like over 100% of the nursing home excess mortality came from COVID, which accords with what I see with excess mortality for older people.

However, there is a lot of excess mortality for people who died at home, and most of that is currently unexplained by COVID.

I don’t think it will be — I think we will find those excess diabetes, heart attack, and ‘unintentional injury’ deaths will have been at home, and because of lockdowns there weren’t other people around to get these people to treatment before they died. This accords with what Emma Woodhouse saw for Illinois – that pattern holds for the entire U.S., it seems.

Author(s): Mary Pat Campbell

Publication Date: 20 April 2021

Publication Site: STUMP at substack