Fitting Yield Curves to rates

Link: https://juliaactuary.org/tutorials/yield-curve-fitting/

Graphic:

Excerpt:

Given rates and maturities, we can fit the yield curves with different techniques in Yields.jl.

Below, we specify that the rates should be interpreted as Continuously compounded zero rates:

using Yields

rates = Continuous.([0.01, 0.01, 0.03, 0.05, 0.07, 0.16, 0.35, 0.92, 1.40, 1.74, 2.31, 2.41] ./ 100)
mats = [1/12, 2/12, 3/12, 6/12, 1, 2, 3, 5, 7, 10, 20, 30]

Then fit the rates under four methods:

  • Nelson-Siegel
  • Nelson-Siegel-Svennson
  • Boostrapping with splines (the default Bootstrap option)
  • Bootstrapping with linear splines
ns =  Yields.Zero(NelsonSiegel(),                   rates,mats)
nss = Yields.Zero(NelsonSiegelSvensson(),           rates,mats)
b =   Yields.Zero(Bootstrap(),                      rates,mats)
bl =  Yields.Zero(Bootstrap(Yields.LinearSpline()), rates,mats)

That’s it! We’ve fit the rates using four different techniques. These can now be used in a variety of ways, such as calculating the present_valueduration, or convexity of different cashflows if you imported ActuaryUtilities.jl

Publication Date: 19 Jun 2022, accessed 22 Jun 2022

Publication Site: JuliaActuary

Python and Excel Working Together

Link: https://www.joveactuarial.com/blog/python-and-excel/

Graphic:

Excerpt:

When we’re exploring using data science tools for actuarial modelling, we’d often like to keep using existing Excel workbooks, which can contain valuable and trusted models and data.

Fortunately, using Python doesn’t mean abandoning Excel as there are some very powerful tools available that allow closely coupled interaction between the two.

These tools allow us to have the “best of both worlds” combining the ease of use of Excel and the power of Python.

We’re going to start with the simplest options and lead through to ways of building workflows that can contain both Excel workbooks and Python code.

With the range of tools available, it should be possible to have the ‘best of both worlds’: the familiarity of existing Excel workbooks and the power of the Python ecosystem working together.

Finally, if you’d like to learn  more, the author of XLWings, Felix Zumstein, has written an excellent book “Python for Excel“, which covers these topics in more detail. Highly recommended.

Author(s): Carl Dowthwaite

Publication Date: 1 Feb 2022

Publication Site: Jove Actuarial

The EEOC wants to make AI hiring fairer for people with disabilities

Link: https://www.brookings.edu/blog/techtank/2022/05/26/the-eeoc-wants-to-make-ai-hiring-fairer-for-people-with-disabilities/

Excerpt:

That hiring algorithms can disadvantage people with disabilities is not exactly new information. In 2019, for my first piece at the Brookings Institution, I wrote about how automated interview software is definitionally discriminatory against people with disabilities. In a broader 2018 review of hiring algorithms, the technology advocacy nonprofit Upturn concluded that “without active measures to mitigate them, bias will arise in predictive hiring tools by default” and later notes this is especially true for those with disabilities. In their own report on this topic, the Center for Democracy and Technology found that these algorithms have “risk of discrimination written invisibly into their codes” and for “people with disabilities, those risks can be profound.” This is to say that there has long been broad consensus among experts that algorithmic hiring technologies are often harmful to people with disabilities, and that given that as many as 80% of businesses now use these tools, this problem warrants government intervention.

….

The EEOC’s concerns are largely focused on two problematic outcomes: (1) algorithmic hiring tools inappropriately punish people with disabilities; and (2) people with disabilities are dissuaded from an application process due to inaccessible digital assessments.

Illegally “screening out” people with disabilities

First, the guidance clarifies what constitutes illegally “screening out” a person with a disability from the hiring process. The new EEOC guidance presents any disadvantaging effect of an algorithmic decision against a person with a disability as a violation of the ADA, assuming the person can perform the job with legally required reasonable accommodations. In this interpretation, the EEOC is saying it is not enough to hire candidates with disabilities in the same proportion as people without disabilities. This differs from EEOC criteria for race, religion, sex, and national origin, which says that selecting candidates at a significantly lower rate from a selected group (say, less than 80% as many women as men) constitutes illegal discrimination.

Author(s): Alex Engler

Publication Date: 26 May 2022

Publication Site: Brookings

Hacker Laws — The Hype Cycle – Amara’s Law

Link: https://github.com/dwmkerr/hacker-laws#the-hype-cycle–amaras-law

Graphic:

Excerpt:

The Hype Cycle on Wikipedia

We tend to overestimate the effect of a technology in the short run and underestimate the effect in the long run.

(Roy Amara)

The Hype Cycle is a visual representation of the excitement and development of technology over time, originally produced by Gartner. It is best shown with a visual:

In short, this cycle suggests that there is typically a burst of excitement around new technology and its potential impact. Teams often jump into these technologies quickly, and sometimes find themselves disappointed with the results. This might be because the technology is not yet mature enough, or real-world applications are not yet fully realised. After a certain amount of time, the capabilities of the technology increase and practical opportunities to use it increase, and teams can finally become productive. Roy Amara’s quote sums this up most succinctly – “We tend to overestimate the effect of a technology in the short run and underestimate in the long run”.

Publication Date: accessed 5 June 2022

Publication Site: github

Is Longevity Escape Velocity Science Fiction?

Link: https://insights.longevityassistant.com/2022/05/is-longevity-escape-velocity-science.html?m=1

Graphic:

Excerpt:

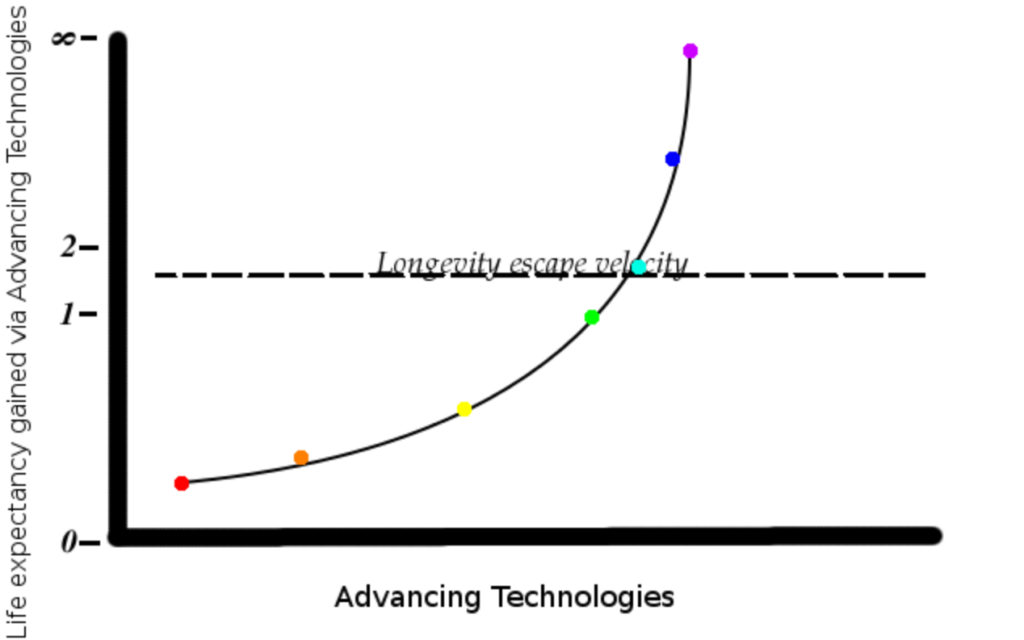
A new series called “Let’s Talk Longevity” kicked of with a conversation (sort of debate) between Drs. Aubrey De Grey and Charles Brenner, centering around the possibility of achieving “Longevity Escape Velocity” (LEV).

De Grey’s position imagines the possibility (50% chance in next few decades) of a “Methusalarity” a moment in which we begin to reverse some aspects of “aging” , primarily via “damage repair” at such a rate that we are able to repair damage in the body as fast as or faster than that damage is occurring. More concretely defined, it can be thought of as 20-30 years more of expected healthy life at age 60 when anti aging therapies begin.

Author(s): Nate Worrell

Publication Date: May 2022, accessed 20 May 2022

Publication Site: Longevity Assistant

Trends in Life Insurance 2022: How the Industry Has Changed

Link: https://www.soa.org/sections/reinsurance/reinsurance-newsletter/2022/april/rsn-2022-04-gambhir/

Graphic:

Excerpt:

Growing popularity in no-medical-exam life insurance products has had one expected outcome: More life insurance policies with accelerated underwriting options available in the marketplace. For example, Policygenius offered just three accelerated underwriting options in 2020. In 2021, that number more than doubled to seven, and more options will likely be available in 2022.

Additionally, while such policies had historically only been available to applicants who were young and in good health, the competitive market has prompted more widespread availability. Now, applicants across all health classes can get no-medical-exam policies.

While no-medical-exam policies tend to be about the same cost as fully underwritten policies, applicants tend to favor them even when they are more expensive due to the convenience and expedited turnaround time.

Author(s): Nupur Gambhir

Publication Date: April 2022

Publication Site: Reinsurance News, SOA

THE FIRST ANNUAL CAS ACTUARIAL
TECHNOLOGY SURVEY

Link: https://www.casact.org/sites/default/files/2022-03/CAS-RP_First_Annual_CAS_Actuarial_Technology_Survey.pdf

Graphic:

Excerpt:

Excel continues to be actuaries’ most widely used software tool, with more than
94.3% of respondents reporting that they use it at least once a day.
• With that understood, most actuaries (92.3%) use more than one tool.
• Actuaries want to increase their proficiency in R (47.2%), Python (39.1%), SQL
(30.8%), and Excel (26.0%).
• No tool had more than 50% of respondents indicating that they wanted to increase
their proficiency.
• Time is the greatest barrier to learning new technology. (80.5% of respondents felt
so.)
• Newer analysis methods such as tree-based algorithms and artificial intelligence (AI)
are not widely used (16.5% and 7.0%, respectively).

Author(s): Casualty Actuarial Society

Publication Date: March 2022

Publication Site: CAS Research Paper

What Machine Learning Can Do for You

Link: https://www.soa.org/sections/investment/investment-newsletter/2022/february/rr-2022-02-romoff/

Excerpt:

Some ML algorithms (e.g., random forests) work very nicely with missing data. No data cleaning is required when using these algorithms. In addition to not breaking down amid missing data, these algorithms use the fact of “missingness” as a feature to predict with. This compensates for when the missing points are not randomly missing.

Or, rather than dodge the problem, although that might be the best approach, you can impute the missing values and work from there. Here, very simple ML algorithms that look for the nearest data point (K-Nearest Neighbors) and infer its value work well. Simplicity here can be optimal because the modeling in data cleaning should not be mixed with the modeling in forecasting.

There are also remedies for missing data in time series. The challenge of time series data is that relationships exist, not just between variables, but between variables and their preceding states. And, from the point of view of a historical data point, relationships exist with the future states of the variables.

For the sake of predicting missing values, a data set can be augmented by including lagged values and negative-lagged values (i.e., future values). This, now-wider, augmented data set will have correlated predictors. The regularization trick can be used to forecast missing points with the available data. And, a strategy of repeatedly sampling, forecasting, and then averaging the forecasts can be used. Or, a similar turnkey approach is to use principal component analysis (PCA) following a similar strategy where a meta-algorithm will repeatedly impute, project, and refit until the imputed points stop changing. This is easier said than done, but it is doable.

Author(s): David Romoff

Publication Date: February 2022

Publication Site: Risks & Rewards, SOA

Digital-first life insurance policies see increase in demand, Policygenius

Link:https://www.dig-in.com/news/policygenius-life-insurance-policies-no-medical-exams

Excerpt:

The demand for digital-first life insurance products has grown in the last year, likely related to the COVID-19 pandemic. From October to December 2021, about 56% of applications submitted through Policygenius were for no-medical exam policies compared to January to March 2021, which was only 26%.

Author(s): Kaitlyn Mattson

Publication Date: 4 Feb 2022

Publication Site: Digital Insurance

Police lose hacked therapy center criminal reports after spreadsheet error

Link:https://www.thebharatexpressnews.com/police-lose-hacked-therapy-center-criminal-reports-after-spreadsheet-error/

Excerpt:

The hack into the client database of the private Vastamo psychotherapy center was first exposed on October 21, 2020, when the patient data of tens of thousands of people was stolen and used to blackmail both l company and patients.

Investigators asked each victim to file a criminal complaint, and as of February 2021, more than 25,000 such reports had been submitted. The majority of complaints were lodged at the Pasila police station in Helsinki, but others were lodged elsewhere in the country.

….

Instead of a database, criminal reports were saved via Microsoft Excel files. Some of the files turned out to be unreadable when the police attempted to transfer them into the official system. The cause of the problem is unknown.

Detective Inspector Jari Illukka from the Helsinki Police Department told Svenska Yle that a dozen crime reports had disappeared from Excel, but the exact number is not known.

….

Police estimate that the records of more than 30,000 people were stolen during the Vastaamo data breach, and more than 22,000 of those victims have since reported the crime.

However, a little more than three thousand declaration forms had been given to the police at the end of January, that is to say one victim in ten.

Publication Date: 7 Feb 2022

Publication Site: Bharat Express News

Getting Started with Julia for Actuaries

Link:https://www.soa.org/digital-publishing-platform/emerging-topics/getting-started-with-julia/

Graphic:

Excerpt:

Sensitivity testing is very common in actuarial workflows: essentially, it’s understanding the change in one variable in relation to another. In other words, the derivative!

Julia has unique capabilities where almost across the entire language and ecosystem, you can take the derivative of entire functions or scripts. For example, the following is real Julia code to automatically calculate the sensitivity of the ending account value with respect to the inputs:

When executing the code above, Julia isn’t just adding a small amount and calculating the finite difference. Differentiation is applied to entire programs through extensive use of basic derivatives and the chain rule. Automatic differentiation, has uses in optimization, machine learning, sensitivity testing, and risk analysis. You can read more about Julia’s autodiff ecosystem here.

Author(s): Alec Loudenback, FSA, MAAA; Dimitar Vanguelov

Publication Date: October 2021

Publication Site: SOA Digital, Emerging Topics

WordXLe: Wordle in Excel

Link:https://sysmod.wordpress.com/2022/01/25/wordxle-wordle-in-excel/

Excerpt:

If you play Wordle daily, or the French version LeMot, you might want to practice more often. For fun, I created an Excel version that you can download, WordXLe. It has sheets for both English and French versions. The dictionaries are:


English main (for validation) c.12000 words from the SOWPODS dictionary; for play c.1100 words.


Version française: principal c.8000 mots; https://github.com/hbenbel/French-Dictionary/blob/master/dictionary/dictionary.txt

Le jeu 1700 mots. https://www.freelang.com/dictionnaire/dic-francais.php
I removed all accents to simplify the game.


It uses Conditional Formatting for colouring, Data Validation to enforce some letter entry rules, no VBA macros, just formulas. The sheets are protected, but it’s easy to unhide things in Excel if you really want to so I’ll leave that as a challenge. 

Author(s): Patrick O’Beirne

Publication Date: 25 Jan 2022

Publication Site: sysmod