Graphic:
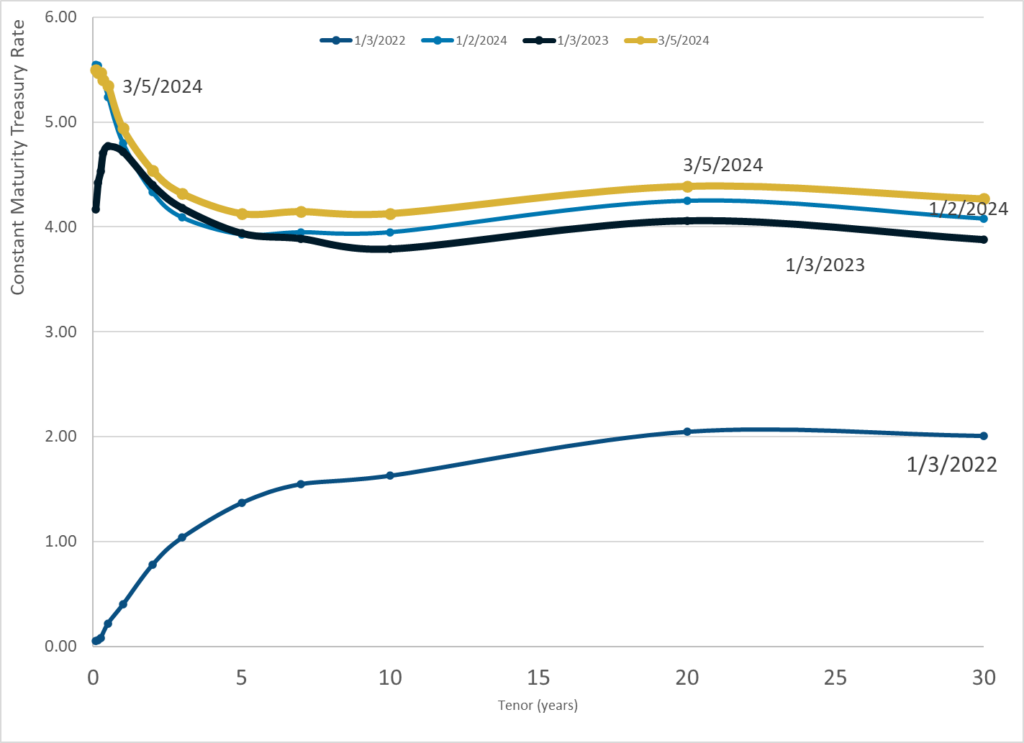
Publication Date: 5 Mar 2024
Publication Site: Treasury Dept
All about risk
Graphic:
Publication Date: 5 Mar 2024
Publication Site: Treasury Dept
Graphic:
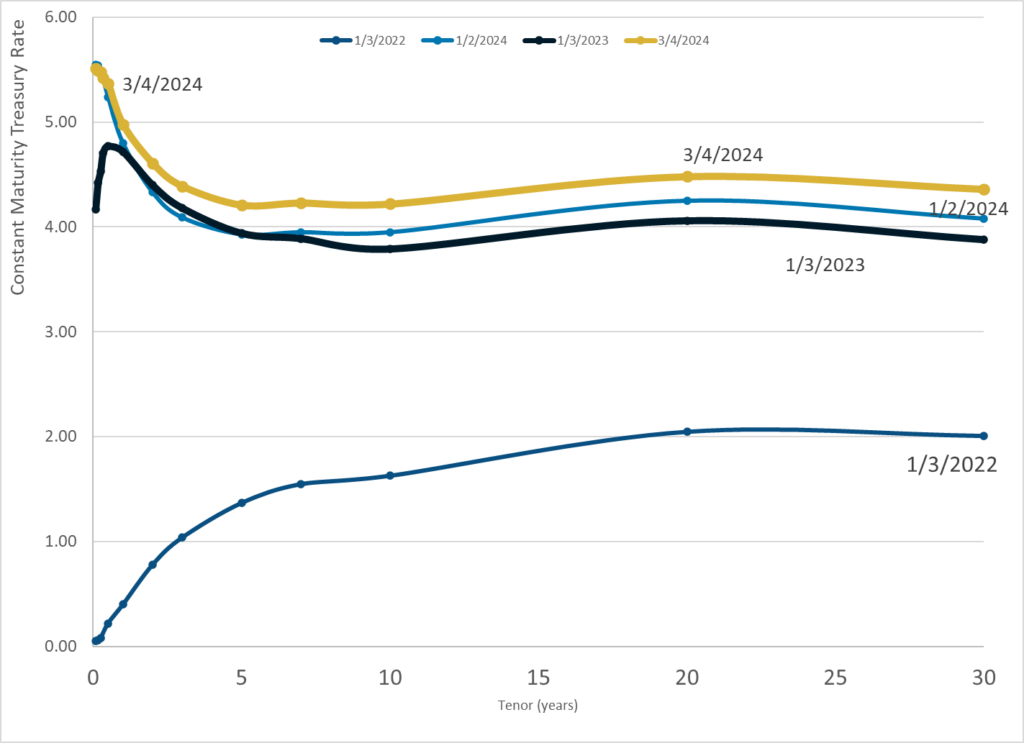
Publication Date: 4 Mar 2024
Publication Site: Treasury Dept
Graphic:
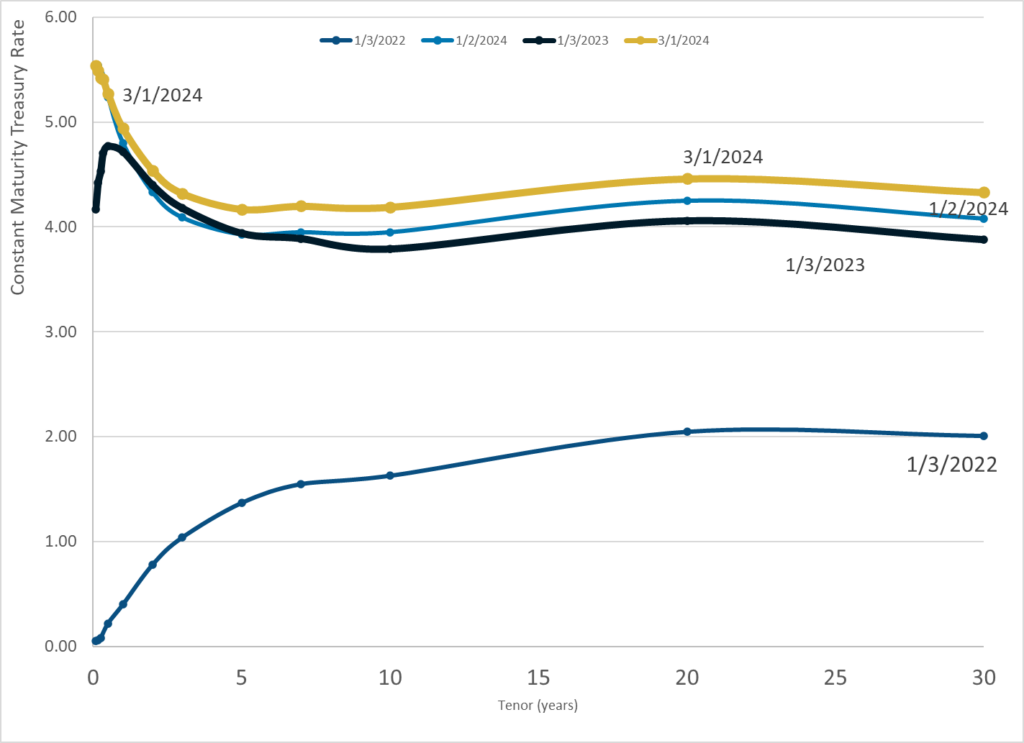
Publication Date: 1 Mar 2024
Publication Site: Treasury Dept
Graphic:
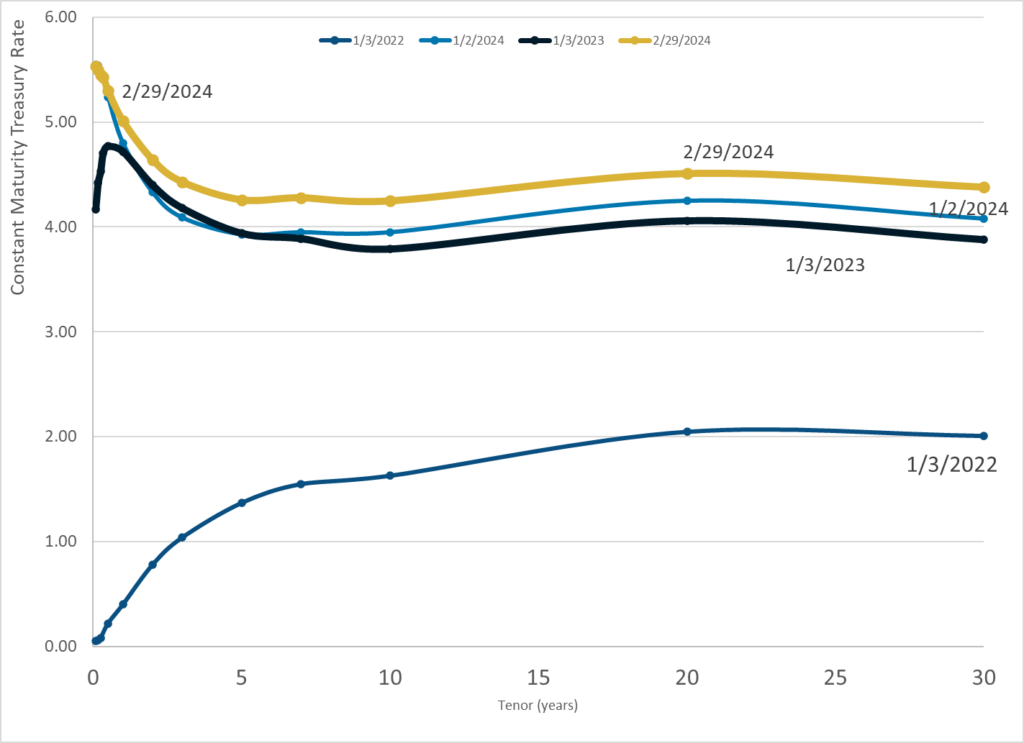
Publication Date: 29 Feb 2024
Publication Site: Treasury Dept
Graphic:

Publication Date: 27 Feb 2024
Publication Site: Treasury Dept
Link: https://www.wsj.com/lifestyle/careers/college-degree-jobs-unused-440b2abd
Graphic:
Excerpt:
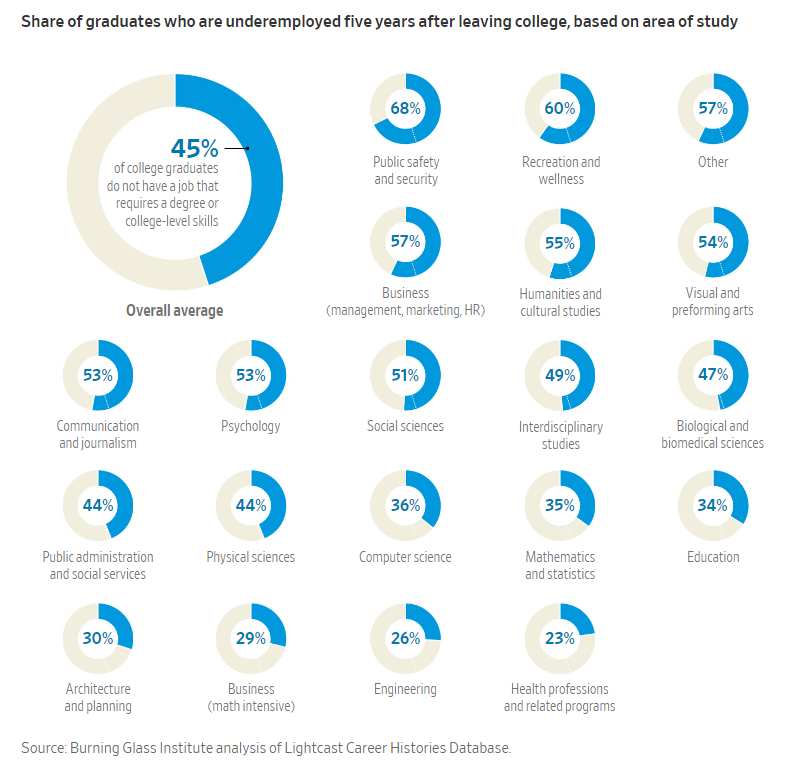
Of the graduates in non-college-level jobs a year after leaving college, the vast majority remained underemployed a decade later, according to researchers at labor analytics firm Burning Glass Institute and nonprofit Strada Education Foundation, which analyzed the résumés of workers who graduated between 2012 and 2021.
More than any other factor analyzed—including race, gender and choice of university—what a person studies determines their odds of getting on a college-level career track. Internships are also critical.
….
Bachelor’s degree holders in college-level jobs earn nearly 90% more than people with just a high-school diploma in their 20s, according to a Burning Glass analysis of 2022 U.S. Census Bureau data.
By comparison, underemployed college graduates earn 25% more than high-school graduates.
….
Contrary to conventional wisdom, not all degrees in science, technology, engineering and math, or STEM, disciplines are a sure bet to landing a job that reflects a college education, the study found.
Nearly half of people who majored in biology and biomedical sciences—47%—remained underemployed five years after graduating. Likewise, business majors less focused on quantitative skills, such as marketing and human resources, were twice as likely to be underemployed than those with math-intensive business degrees, such as accounting or finance. The data cover graduates who didn’t get master’s or other advanced degrees after college.
Author(s): Vanessa Fuhrmans and Lindsay Ellis
Publication Date: 22 Feb 2024
Publication Site: WSJ
Graphic:

Excerpt:
I was reminded of this student’s clever ploy when Frederik Joelving, a journalist with Retraction Watch, recently contacted me about a published paper written by two prominent economists, Almas Heshmati and Mike Tsionas, on green innovations in 27 countries during the years 1990 through 2018. Joelving had been contacted by a PhD student who had been working with the same data used by Heshmati and Tsionas. The student knew the data in the article had large gaps and was “dumbstruck” by the paper’s assertion these data came from a “balanced panel.” Panel data are cross-sectional data for, say, individuals, businesses, or countries at different points in time. A “balanced panel” has complete cross-section data at every point in time; an unbalanced panel has missing observations. This student knew firsthand there were lots of missing observations in these data.
The student contacted Heshmati and eventually obtained spreadsheets of the data he had used in the paper. Heshmati acknowledged that, although he and his coauthor had not mentioned this fact in the paper, the data had gaps. He revealed in an email that these gaps had been filled by using Excel’s autofill function: “We used (forward and) backward trend imputations to replace the few missing unit values….using 2, 3, or 4 observed units before or after the missing units.”
That statement is striking for two reasons. First, far from being a “few” missing values, nearly 2,000 observations for the 19 variables that appear in their paper are missing (13% of the data set). Second, the flexibility of using two, three, or four adjacent values is concerning. Joelving played around with Excel’s autofill function and found that changing the number of adjacent units had a large effect on the estimates of missing values.
Joelving also found that Excel’s autofill function sometimes generated negative values, which were, in theory, impossible for some data. For example, Korea is missing R&Dinv (green R&D investments) data for 1990-1998. Heshmati and Tsionas used Excel’s autofill with three years of data (1999, 2000, and 2001) to create data for the nine missing years. The imputed values for 1990-1996 were negative, so the authors set these equal to the positive 1997 value.
Author(s): Gary Smith
Publication Date: 21 Feb 2024
Publication Site: Retraction Watch
Graphic:
Publication Date: 26 Feb 2024
Publication Site: Treasury Dept
Graphic:
Publication Date: 23 Feb 2024
Publication Site: Treasury Dept
Link:https://manhattan.institute/article/the-limits-of-taxing-the-rich
Graphic:
Excerpt:
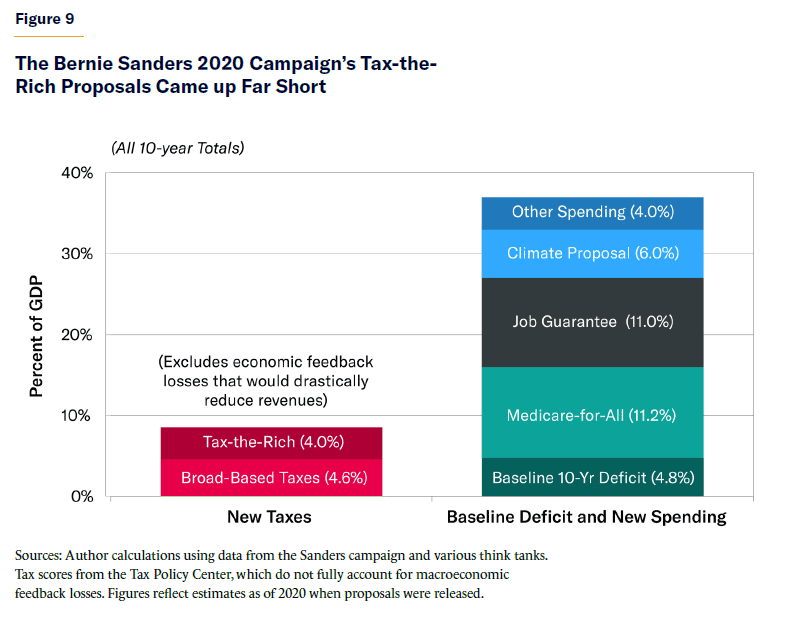
Sanders’s agenda is not limited to taxes on corporations and wealthy families. The campaign also proposed to partially finance Medicare-for-All through 4.6% of GDP in new tax revenues from broad-based payroll taxes and tax-preference eliminations (within health care). However, even if one uses the inflated revenue figure of 8.6% of GDP (4.0% from the wealthy and 4.6% from broad-based taxes), it still falls far short of financing Sanders’s spending promises. Sanders proposed $23 trillion in new taxes over the 2021–30 period, yet also proposed a $30 trillion Medicare-for-All plan, $30 trillion government job guarantee, $16 trillion climate initiative, and $11 trillion for free public college tuition, full student-loan forgiveness, Social Security expansion, housing, infrastructure, paid family leave, and K–12 education. That is $87 trillion in spending promises, on top of a baseline budget deficit that, at the time, was forecast at $13 trillion over the decade.[104] Even the rosiest revenue estimates of Sanders’s tax policies would cover only a small fraction of his spending promises (see Figure 9).
At the same time, Sanders has obfuscated the funding shortfall by: 1) regularly claiming that his tax policies can cover all his spending promises, even as official scores show otherwise; and 2) proposing most spending increases separately, in order to make each one appear individually affordable within his broader tax agenda.
Summary: Some progressives suggest that Bernie Sanders has identified extraordinary potential revenues from taxing the rich. However, his proposed tax increases on corporations and wealthy individuals show revenues of 4% of GDP—and that is before accounting for constitutional challenges and unrealistic tax rates that far exceed the consensus of revenue-maximizing rates. Given behavioral and economic responses, the total potential tax revenues are (at most) 2% of GDP, and possibly far less. Indeed, leading progressive tax officials assume plausible tax rates and revenues far below those of Sanders’s proposals. Even assuming Sanders’s full static revenue estimate and including his steep middle-class tax proposals would not come close to paying for his spending agenda. The contention that Sanders has unlocked an enormous tax-the-rich revenue source is false.
Author(s): Brian Riedl
Publication Date: 21 Sept 2023
Publication Site: Manhattan Institute
Graphic:
Excerpt:
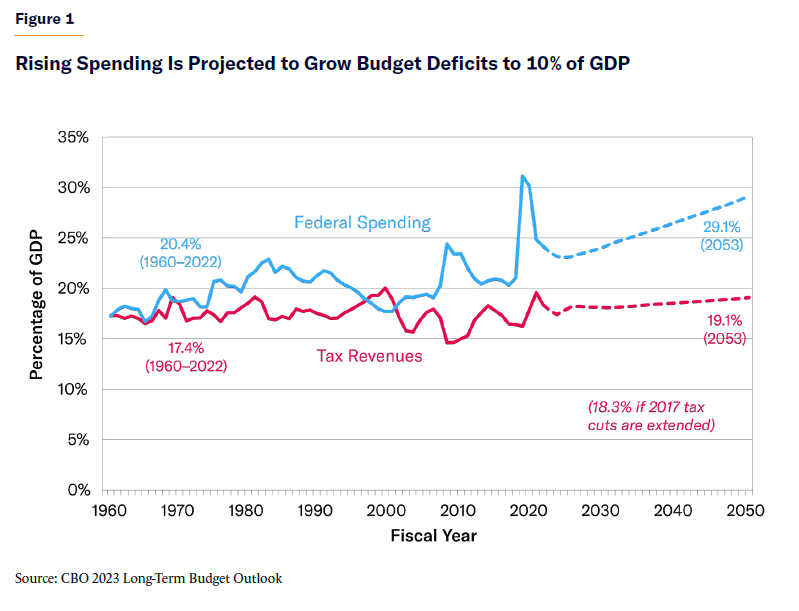
As budget deficits surge toward the stratosphere, Congress will soon have to get serious about savings proposals. Yet reforming Social Security and Medicare—the leading drivers of long-term deficits—remains a political nonstarter. Neither party is willing to raise middle-class taxes. And cutting defense and social spending would save at most $200 billion annually from deficits that are projected to approach $3 trillion by 2034.
That leaves one option: Tax the rich. It won’t be nearly enough.
There are a few excessive tax loopholes and undertaxed corporations that lawmakers could address. It’s farcical, however, to suggest that the tax-the-rich pot of gold is large enough to rein in our deficits and finance new spending programs. Seizing every dollar of income earned over $500,000 wouldn’t balance the budget. Liquidating every dollar of billionaire wealth would fund the federal government for only nine months.
In a study for the Manhattan Institute, I set upper-income tax rates at their revenue-maximizing level, while paring back tax loopholes and fighting tax evasion. As background, the Congressional Budget Office projects that our budget deficits—which currently exceed 7% of gross domestic project—will surpass 10% of GDP over the next three decades. My research shows that the “tax the rich” model would raise at most 2% of GDP in additional revenue over the long term.
Author(s): Brian Riedl
Publication Date: 22 Jan 2024
Publication Site: WSJ, op-ed
Graphic:
Publication Date: 22 Feb 2024
Publication Site: Treasury Dept