Graphic:
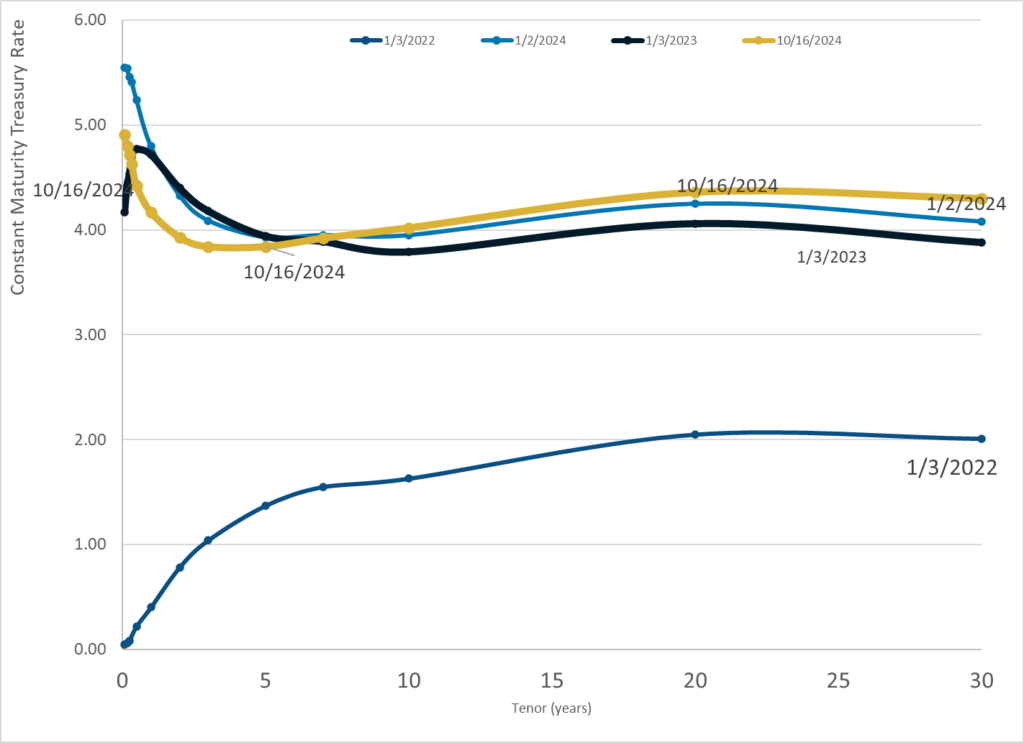
Publication Date: 16 Oct 2024
Publication Site: Treasury Dept
All about risk
Graphic:
Publication Date: 16 Oct 2024
Publication Site: Treasury Dept
Graphic:
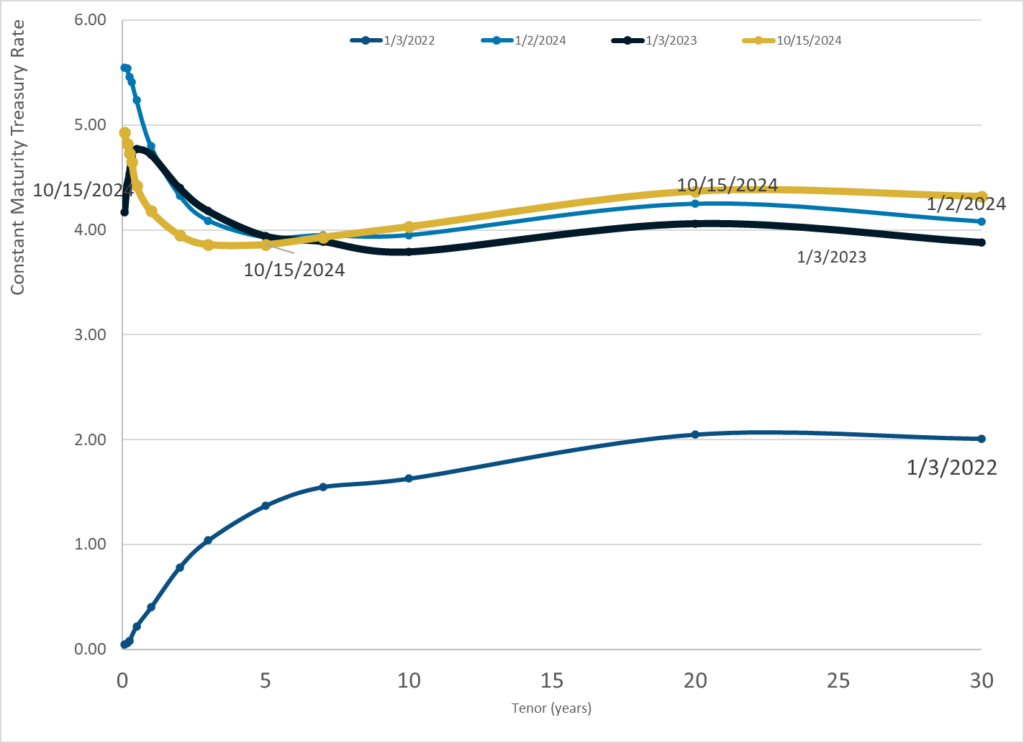
Publication Date: 15 Oct 2024
Publication Site: Treasury Dept
Graphic:
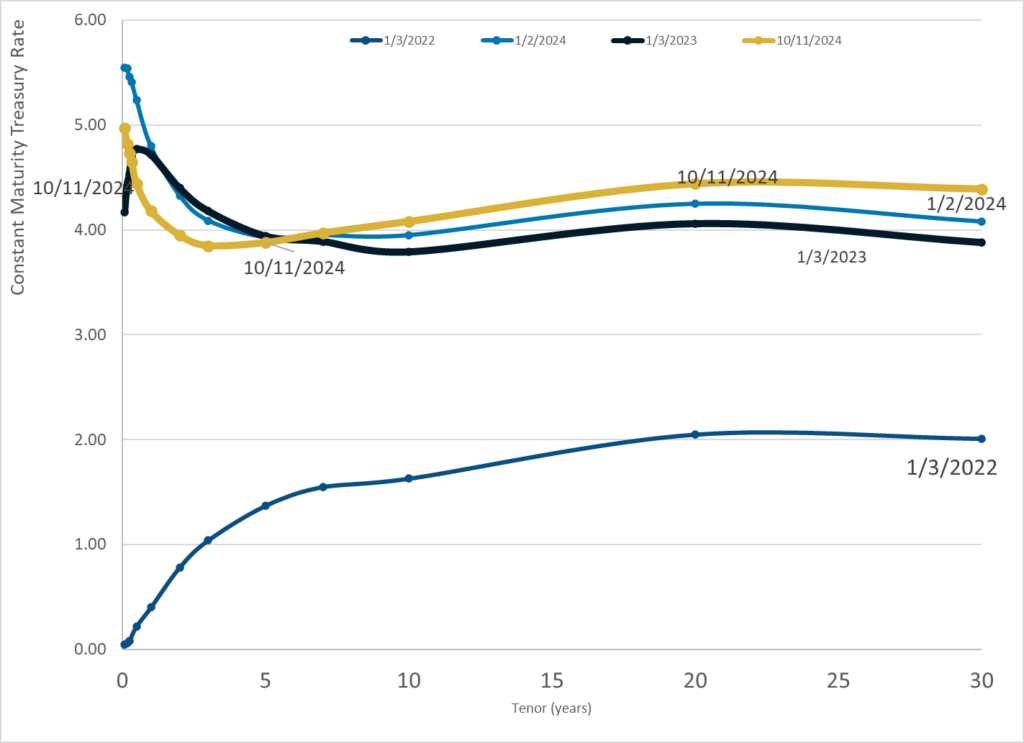
Publication Date: 11 Oct 2024
Publication Site: Treasury Dept
Graphic:
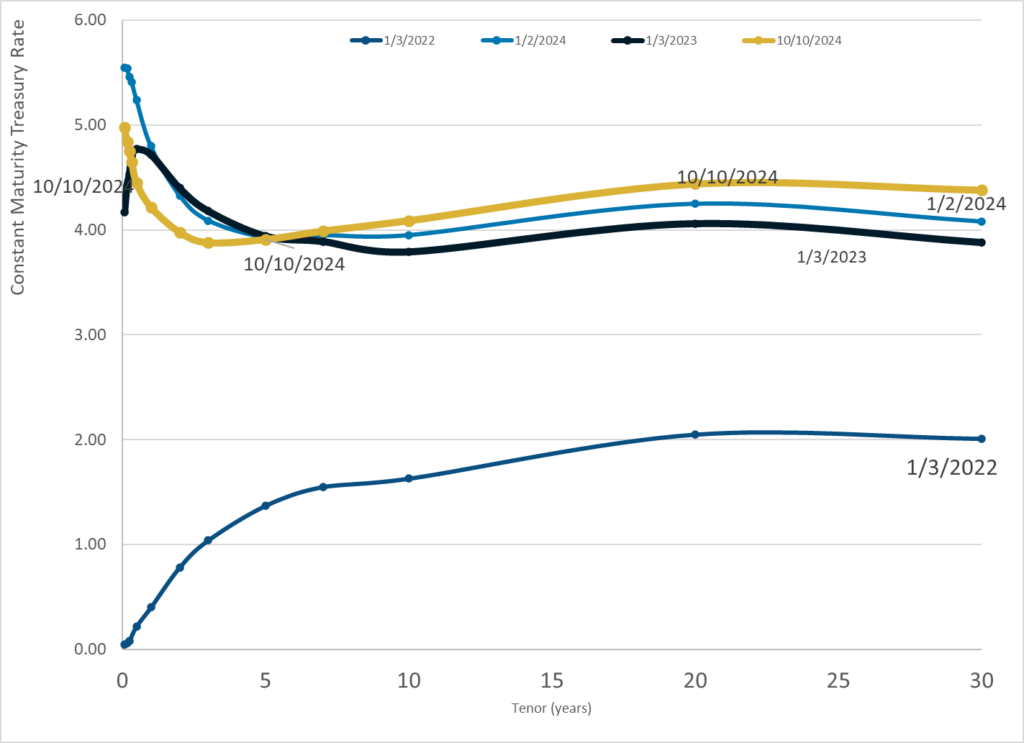
Publication Date: 10 Oct 2024
Publication Site: Treasury Dept
Graphic:
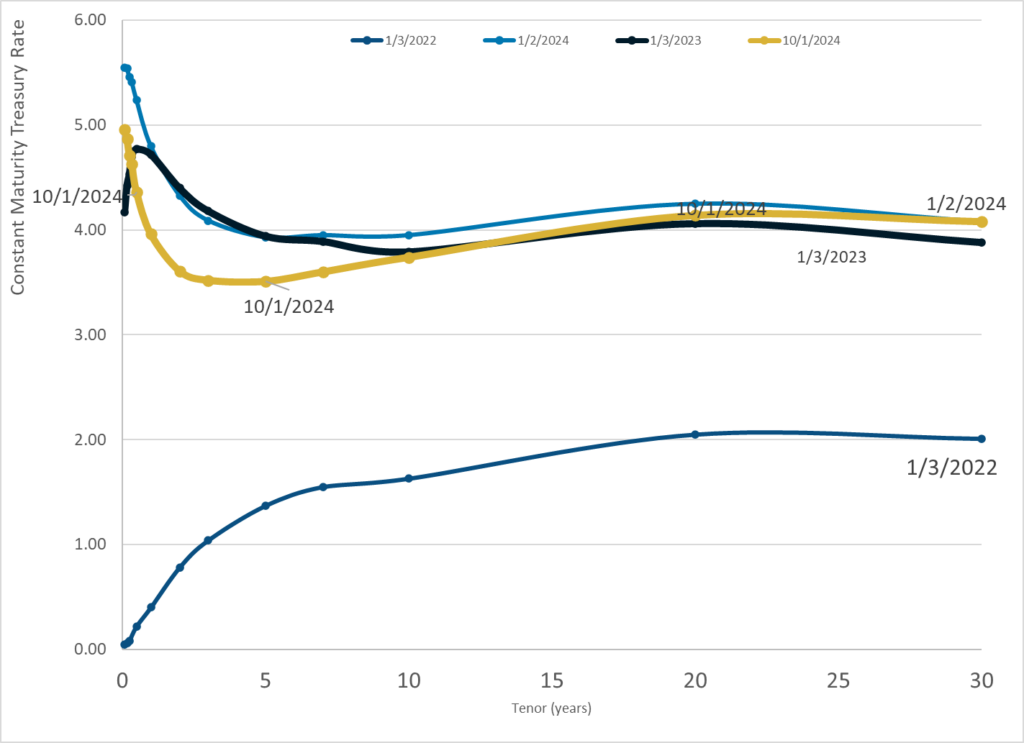
Publication Date: 1 Oct 2024
Publication Site: Treasury Dept
Graphic:
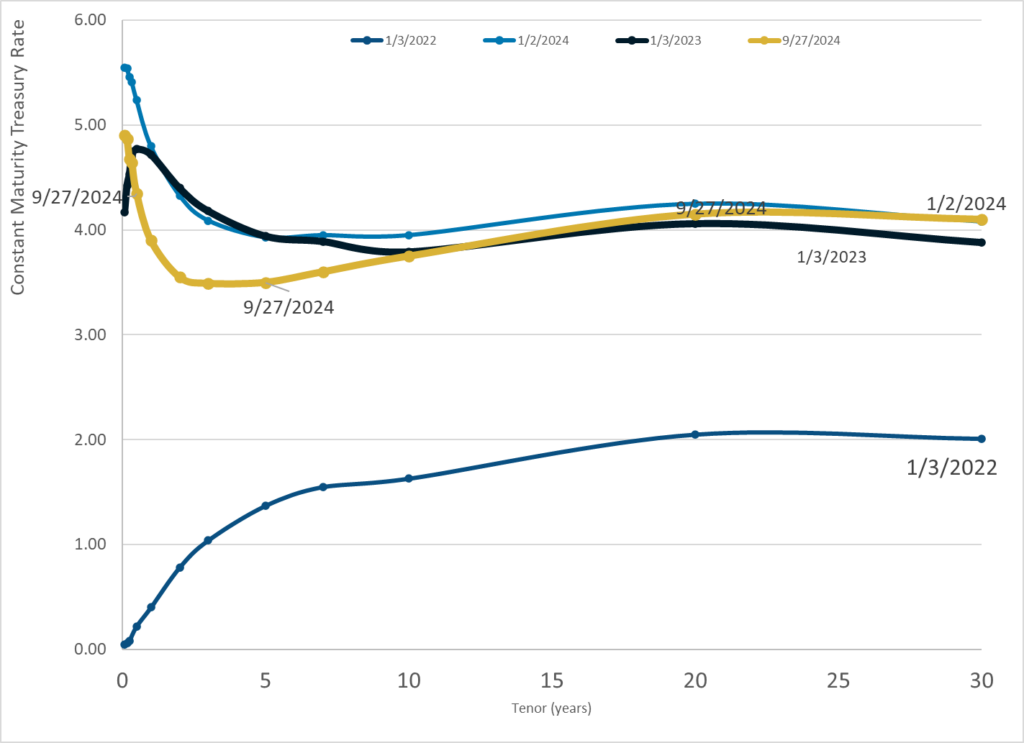
Publication Date: 27 Sept 2024
Publication Site: Treasury Dept
Graphic:

Publication Date: 24 Sept 2024
Publication Site: Treasury Dept
Link: https://www.visualcapitalist.com/growth-in-working-age-populations-over-10-years/
Graphic:
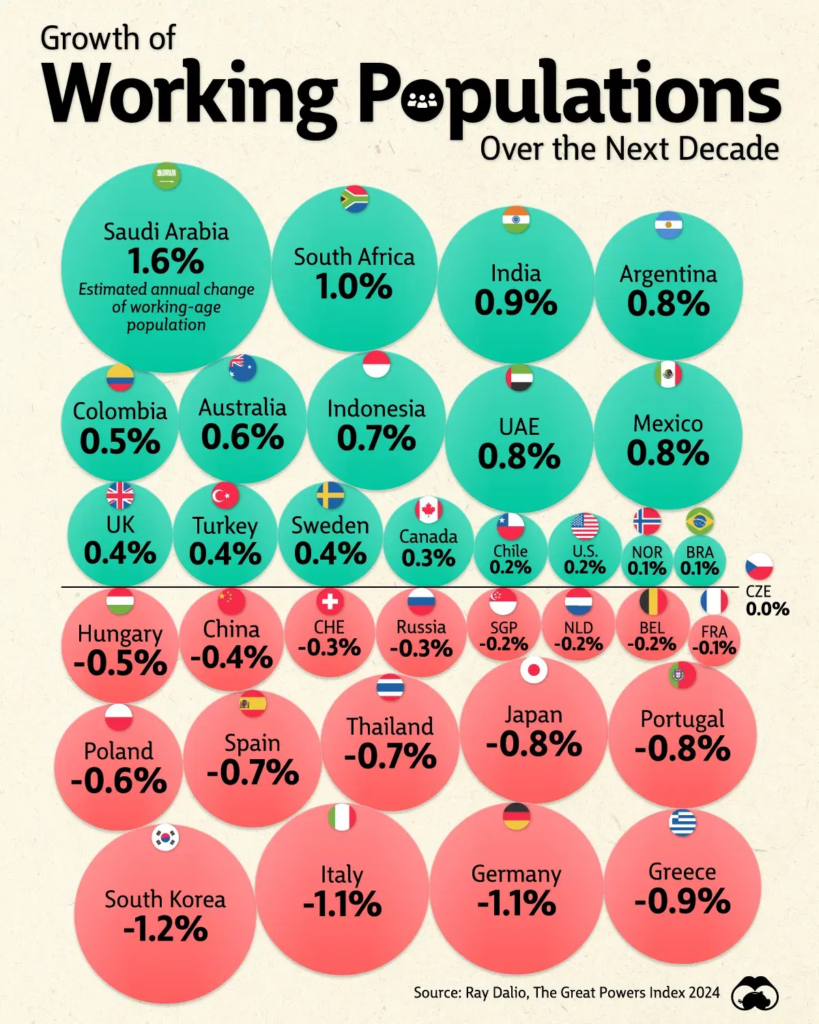
Excerpt:
Today, the working age population in almost half of U.S. metropolitan areas has declined due to demographic shifts, and this trend is set to continue.
As a result, the U.S. workforce is projected to grow at just 0.2% annually over the next decade, roughly a quarter of the rate of markets like India and Mexico. Given the low birth rates and aging populations across many advanced economies, the world’s workforce is set to change significantly, with implications for economic and productivity growth.
This graphic shows the projected growth in major economies’ working age population, based on analysis from Ray Dalio’s Great Powers Index 2024.
Author(s): Dorothy Neufeld
Publication Date: 23 Sept 2024
Publication Site: Visual Capitalist
Graphic:
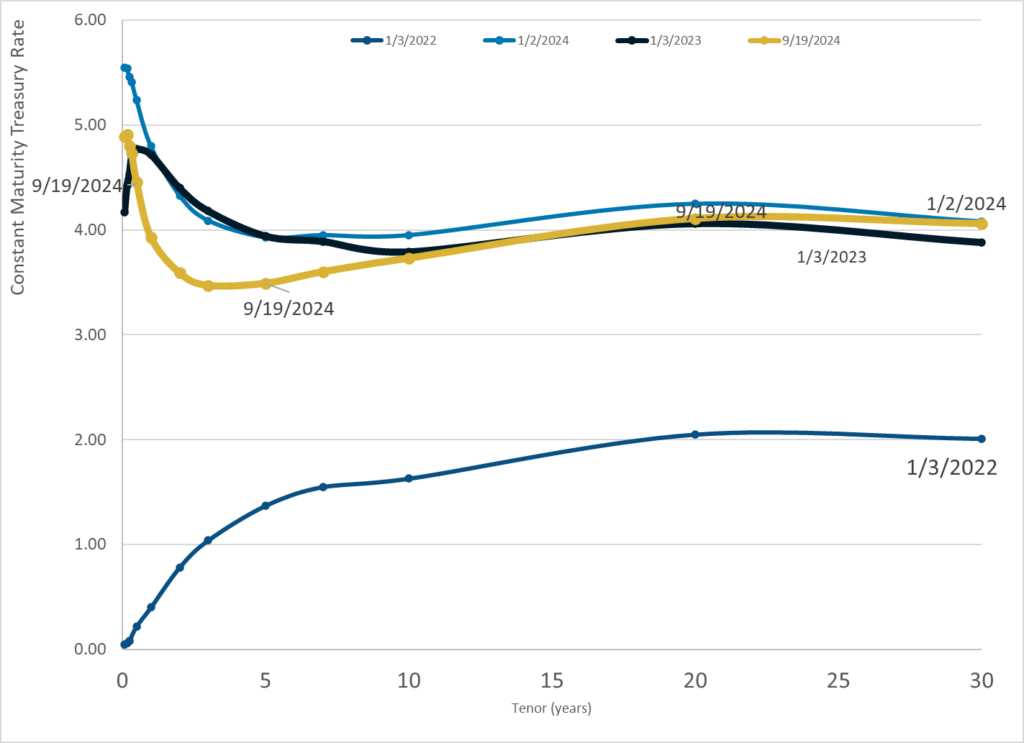
Publication Date: 19 Sept 2024
Publication Site: Treasury Dept
Graphic:
Publication Date: 18 Sept 2024
Publication Site: Treasury Dept
Link: https://www.cnbc.com/2024/09/18/fed-cuts-rates-september-2024-.html
Graphic:
Excerpt:
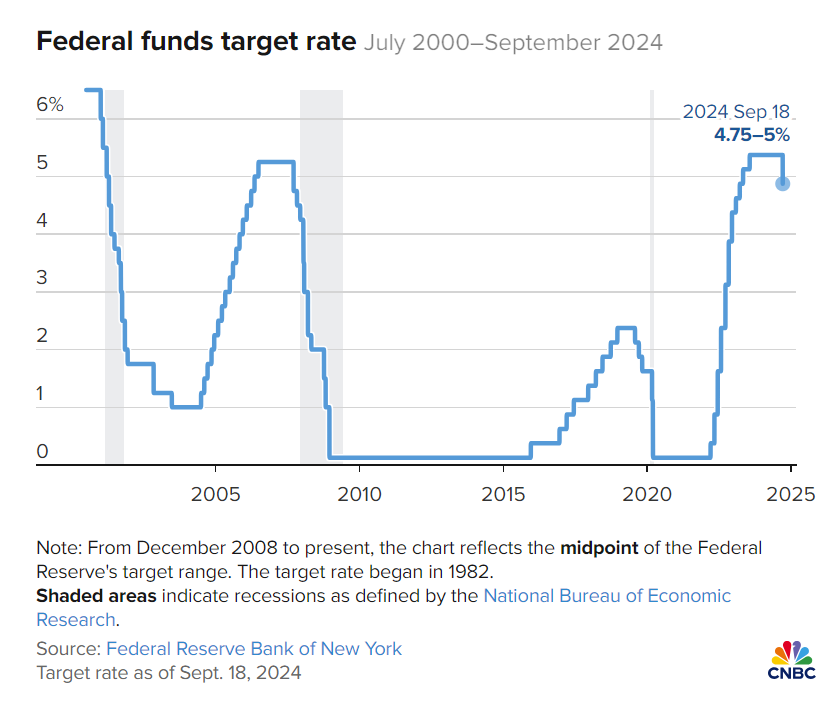
WASHINGTON – The Federal Reserve on Wednesday enacted its first interest rate cut since the early days of the Covid pandemic, slicing half a percentage point off benchmark rates in an effort to head off a slowdown in the labor market.
With both the jobs picture and inflation softening, the central bank’s Federal Open Market Committee chose to lower its key overnight borrowing rate by a half percentage point, or 50 basis points, affirming market expectations that had recently shifted from an outlook for a cut half that size.
Outside of the emergency rate reductions during Covid, the last time the FOMC cut by half a point was in 2008 during the global financial crisis.
The decision lowers the federal funds rate to a range between 4.75%-5%. While the rate sets short-term borrowing costs for banks, it spills over into multiple consumer products such as mortgages, auto loans and credit cards.
In addition to this reduction, the committee indicated through its “dot plot” the equivalent of 50 more basis points of cuts by the end of the year, close to market pricing. The matrix of individual officials’ expectations pointed to another full percentage point in cuts by the end of 2025 and a half point in 2026. In all, the dot plot shows the benchmark rate coming down about 2 percentage points beyond Wednesday’s move.
Author(s): Jeff Cox
Publication Date: 18 Sept 2024
Publication Site: CNBC
Graphic:
Excerpt:
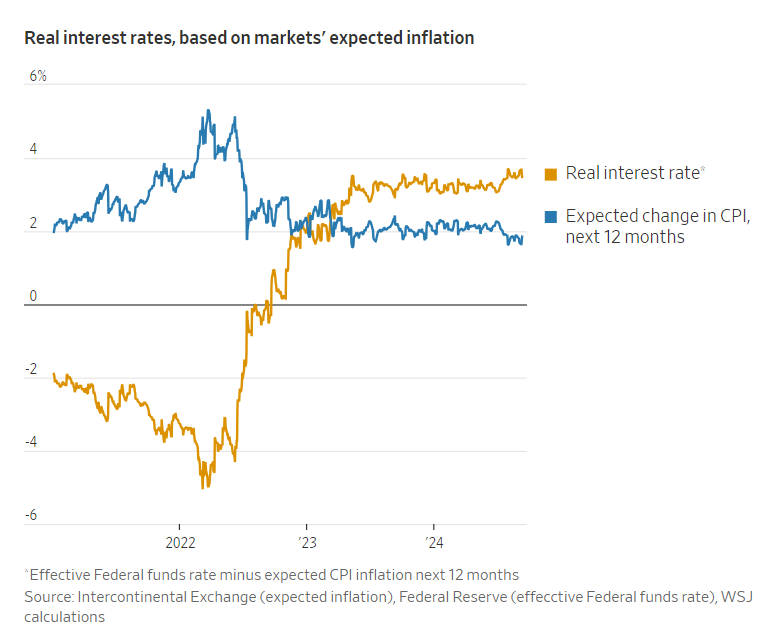
A year ago inflation as measured by the consumer-price index was 3.2%. In August, it was 2.5%. In that time, core inflation, which excludes food and energy, has fallen from 4.2% to an estimated 2.7%, using the Fed’s preferred gauge, the price index of personal-consumption expenditures, or PCE.
The gap between 2.7% and the Fed’s 2% target largely reflects the lagged effects of higher housing, auto and other prices from a few years ago. Some alternative indexes attempt to exclude such idiosyncratic factors. Harvard University economist Jason Furman averages several over different time horizons to yield a single, PCE-equivalent underlying inflation rate. It was 2.2% in August, the lowest since early 2021.
Inflation is likely to keep falling. Oil has plunged from $83 a barrel in early July to below $70 on Friday. This will directly lower headline inflation and, indirectly, core inflation because oil is an input into almost every business. A study by Robert Minton, now at the Fed, and Brian Wheaton at the University of California, Los Angeles, found oil can explain 16% of fluctuations in core inflation, and it takes two years for 80% of the effect to show up.
Author(s): Greg Ip
Publication Date: 15 Sept 2024
Publication Site: WSJ