Fundamentals of Data Visualization

Link: https://clauswilke.com/dataviz/

Graphic:

Excerpt:

This is the website for the book “Fundamentals of Data Visualization,” published by O’Reilly Media, Inc. The website contains the complete author manuscript before final copy-editing and other quality control. If you would like to order an official hardcopy or ebook, you can do so at various resellers, including Amazon, Barnes and Noble, Google Play, or Powells.

The book is meant as a guide to making visualizations that accurately reflect the data, tell a story, and look professional. It has grown out of my experience of working with students and postdocs in my laboratory on thousands of data visualizations. Over the years, I have noticed that the same issues arise over and over. I have attempted to collect my accumulated knowledge from these interactions in the form of this book.

Author(s): Claus O. Wilke

Publication Date: accessed 20 May 2022

Publication Site: Claus Wilke’s site
The pandemic’s reported death toll will soon reach 1 million people in the United States.

Link: https://www.washingtonpost.com/opinions/interactive/2022/how-many-people-died-covid-united-states-1-million-graphic/

Graphic:

Excerpt:

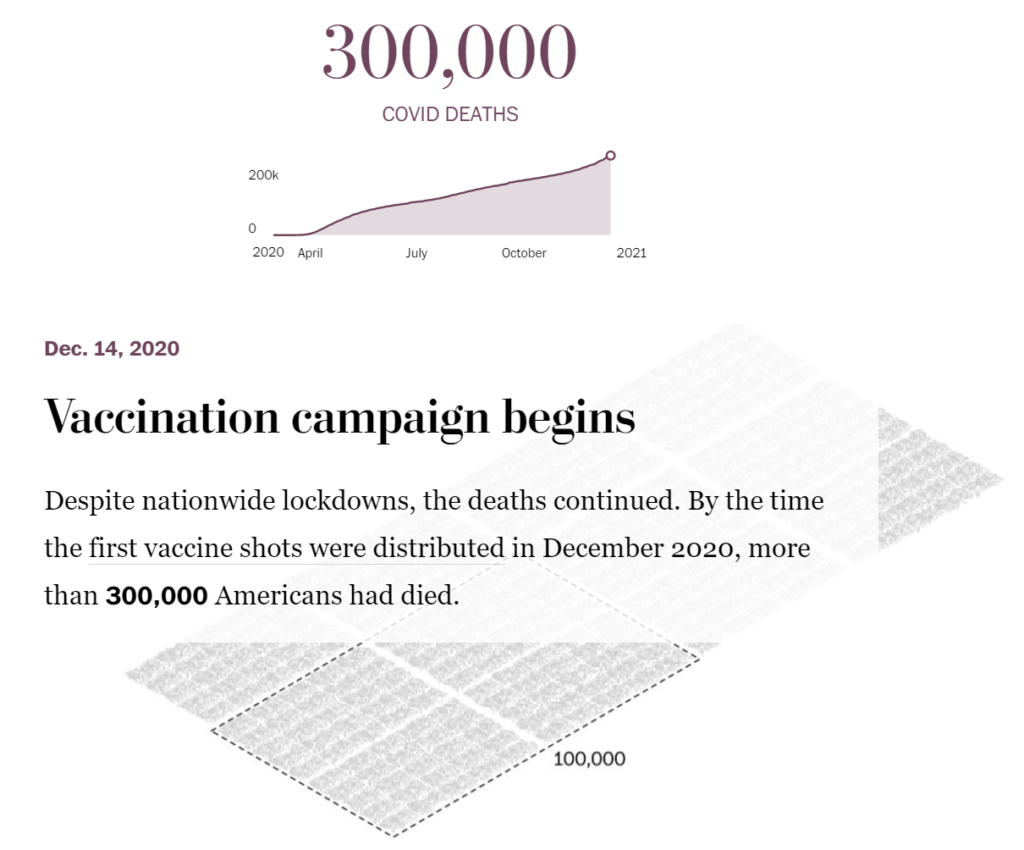
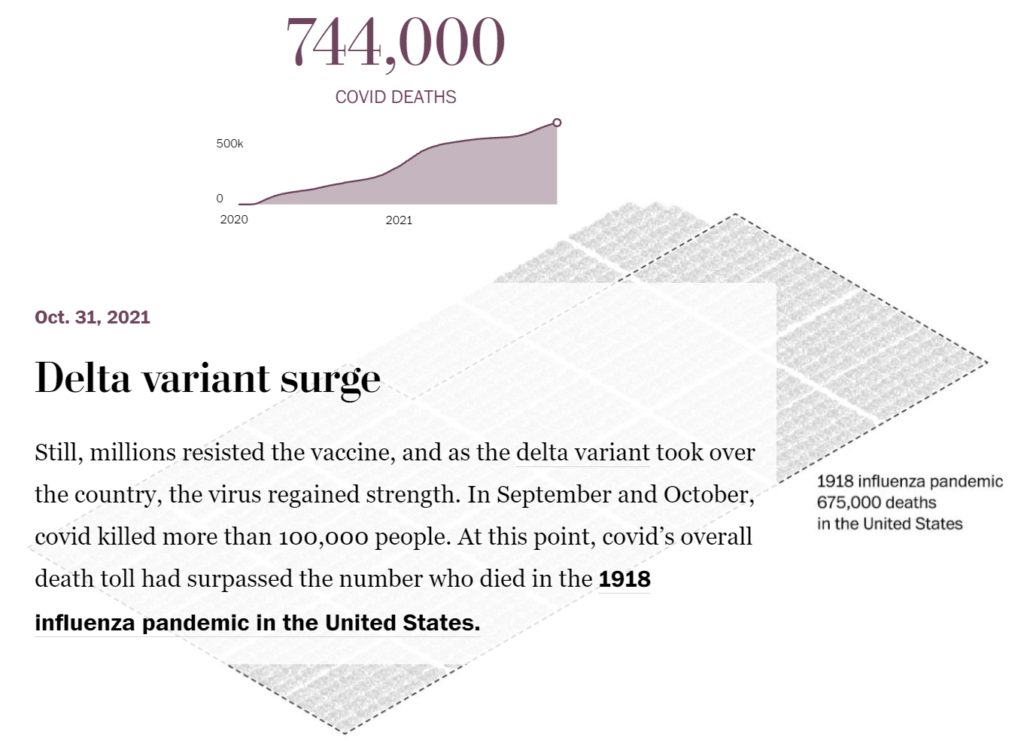
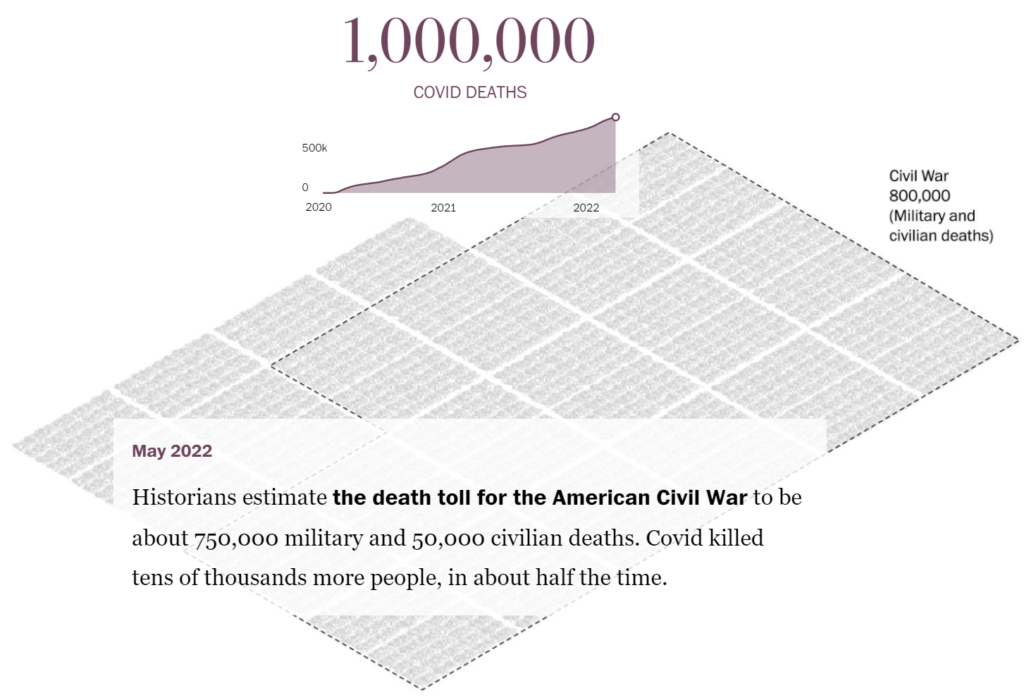
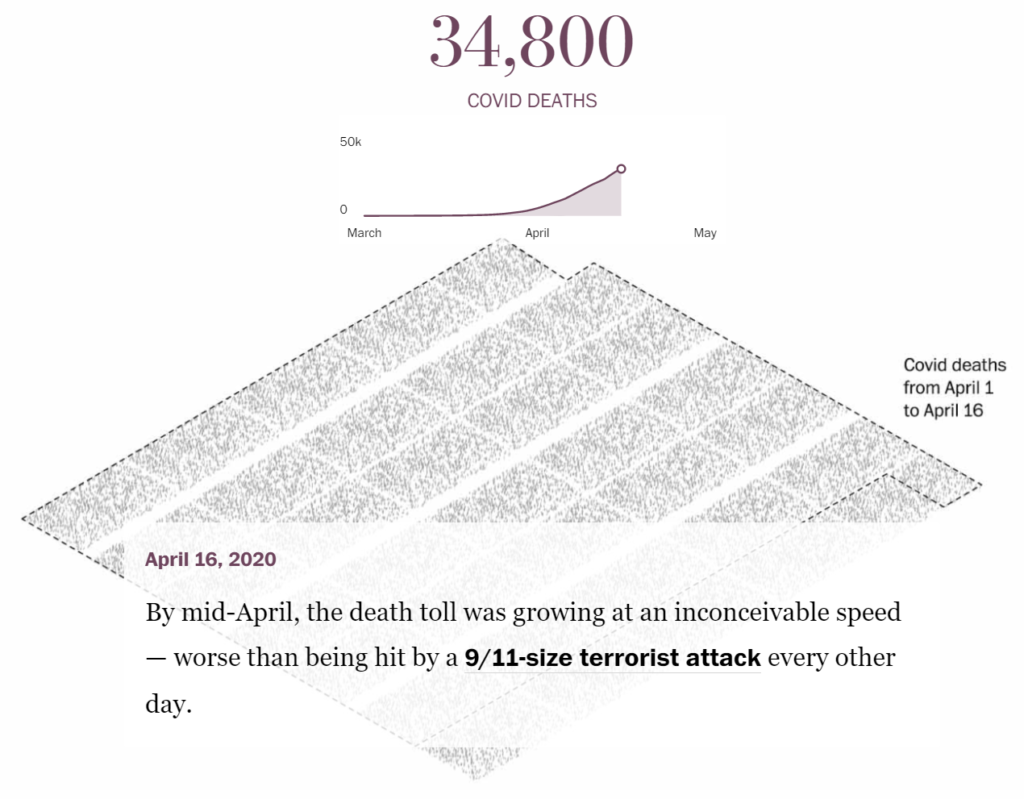
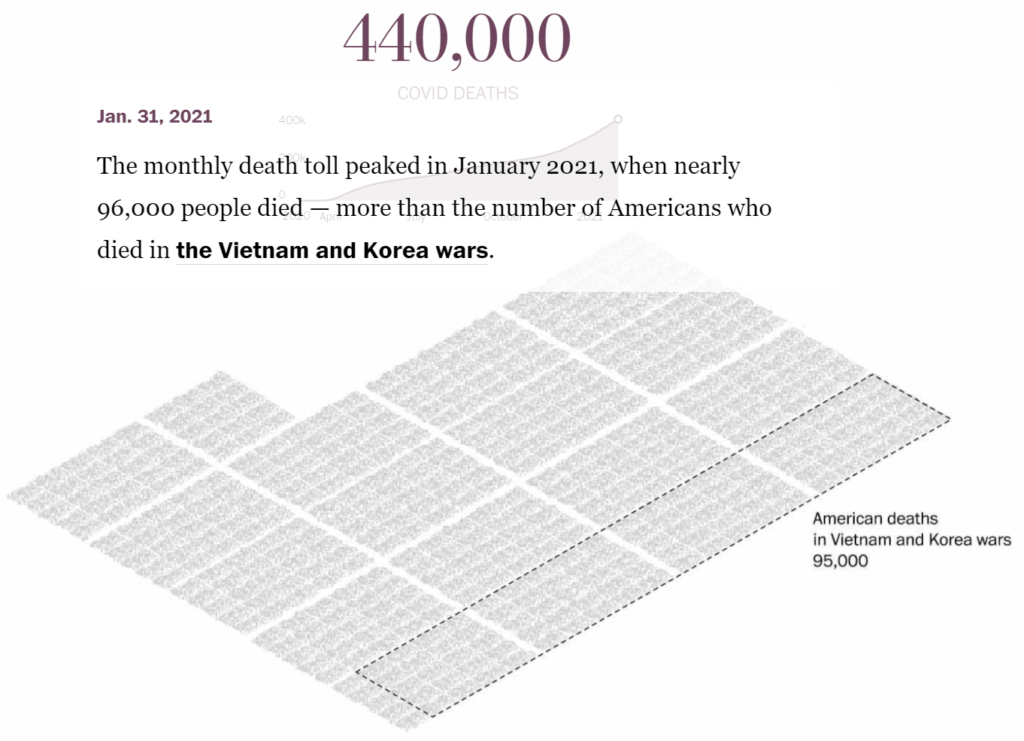
The pandemic’s death toll in the United States will surpass 1 million people in the coming days. Conveying the meaning or the magnitude of this number is impossible. But 1 million deaths is the benchmark of an unprecedented American tragedy.

Consider this comparison: The population of D.C. is about 670,000 people. Try to imagine life without every person, in every building, on every street, in the nation’s capital. And then imagine another 330,000 people are gone.

To attempt to put the 1 million deaths in context, we plotted its damage over more than two years and compared the continuing death toll with the tolls from previous catastrophes in our history.

Author(s): Sergio Peçanha and Yan Wu

Publication Date: 12 May 2022

Publication Site: Washington Post

The Most Detailed Map of Cancer-Causing Industrial Air Pollution in the U.S.

Link: https://projects.propublica.org/toxmap/?utm_source=sailthru&utm_medium=email&utm_campaign=datastore&utm_content=river

Graphic:

Excerpt:

ProPublica’s analysis of five years of modeled EPA data identified more than 1,000 toxic hot spots across the country and found that an estimated 250,000 people living in them may be exposed to levels of excess cancer risk that the EPA deems unacceptable.

The agency has long collected the information on which our analysis is based. Thousands of facilities nationwide that are considered large sources of toxic air pollution submit a report to the government each year on their chemical emissions.

But the agency has never released this data in a way that allows the public to understand the risks of breathing the air where they live. Using the reports submitted between 2014 and 2018, we calculated the estimated excess cancer risk from industrial sources across the entire country and mapped it all.

The EPA’s threshold for an acceptable level of cancer risk is 1 in 10,000, meaning that of 10,000 people living in an area, there would likely be one additional case of cancer over a lifetime of exposure. But the agency has also said that ideally, Americans’ added level of cancer risk from air pollution should be far lower, 1 in a million. Our map highlights areas where the additional cancer risk is greater than 1 in 100,000 — 10 times lower than the EPA’s threshold, but still high enough to be of concern, experts say.

Author(s): Al Shaw and Lylla Younes, Additional reporting by Ava Kofman

Publication Date: last updated 15 Mar 2022, accessed 16 Mar 2022

Publication Site: ProPublica

Free DataViz Tools & Resources

Link: https://policyviz.com/2022/02/14/free-dataviz-tools-resources/

Excerpt:

One of the best, cheapest ways to get better at visualizing and communicating your data is blogs. The first five blogs I’ve listed here publish more regularly than some of the others I include at the end of the list. There are a few tools-specific blogs listed at the end as well (of which there are so many, it’s hard to know where to start). These are just the blogs that I regularly try to keep up with; there are many others that you might find useful as well.

  • Depict Data Studio. Ann Emery’s stuff is great, especially if you want to learn how to create better, more effective reports.
  • Datawrapper. Lisa Charlotte Muth is the primary blogger here and the content is always amazing. The content is not specific to the Datawrapper tool.
  • Flowing Data. Nathan Yau sends out a daily example of a data visualization. I’m also a member of Flowing Data ($100 for the year), which gives me access to additional written content plus tutorials in D3, R, and Excel (often written by others).
  • Nightingale (from the Data Visualization Society). Collaborative effort from a variety of folks in the data visualization field. If you’re interested in blogging about your data visualization journey but don’t want the hassle of hosting your own site, you might want to reach out to the editors here.
  • Storytelling with Data. Cole Nussbaumer Knaflic’s site is one of the tops in the field and the recent addition of the SWD “challenges” and “community” (see below) are great community-based additions to the platform.

Author(s): Jon Schwabish

Publication Date: 14 Feb 2022

Publication Site: PolicyViz

Mortality Nuggets: Videos on Suicide Rate Trends, Society of Actuaries Report, and Fixing Their Graph

Link:https://marypatcampbell.substack.com/p/mortality-nuggets-videos-on-suicide

Video:

Graphic:

Excerpt:

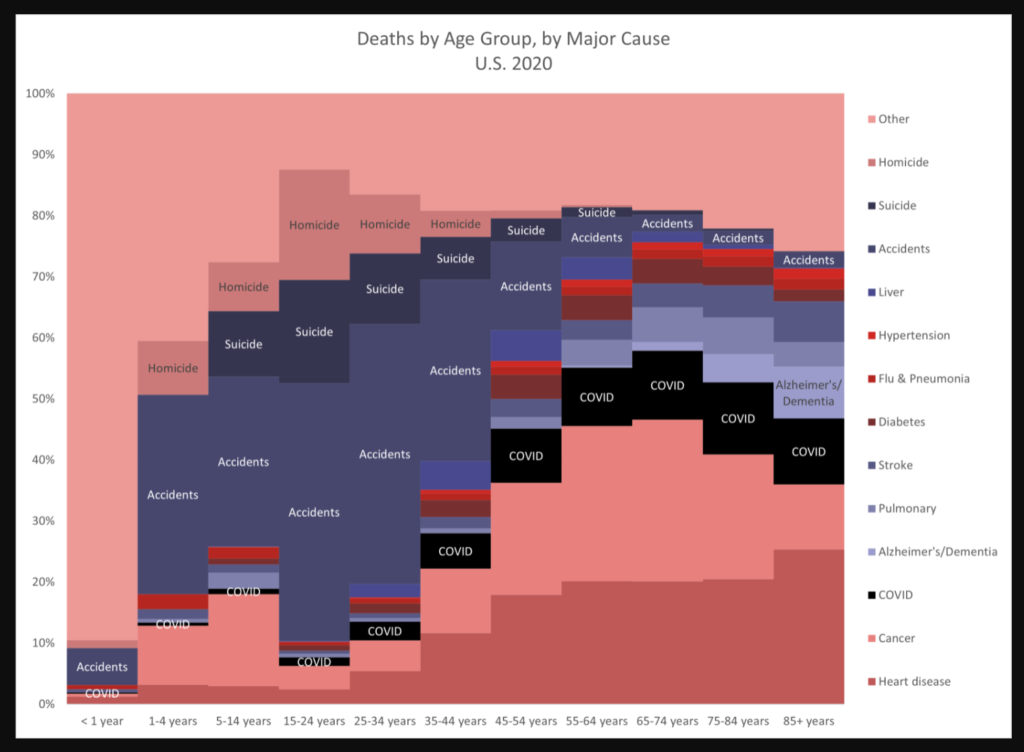
  • I highlighted a few of the cause-of-death trends. In particular, COVID (which, obviously, is biased more towards the old), and external causes of death: homicide, suicide, and accidents (which includes drug overdoses and motor vehicle accidents).
  • There are basically too many things going on in this graph, so there aren’t a lot of good choices for either me or the SOA. What I did was to pick four of the data series to highlight with data labels, as noted above (and I also slapped one data label on dementia for the oldest age group, just because). I am in the middle of a series going through how that external causes of death changed in 2020 — in particular, accidents and homicides went up, and really affected mortality for adults under age 45, plus male teens.
  • Yeah, check out heart disease and cancer (bottom of the graph). Ain’t old age great?

Author(s): Mary Pat Campbell

Publication Date: 6 Feb 2022

Publication Site: STUMP at substack

Lego builds itself (back) up

Link:https://blog.datawrapper.de/lego-sets-colors-history/

Graphic:

Excerpt:

Some of Lego’s basic colors, like black and white, seem to maintain their representation across the years. However, other classics like red, blue, and yellow decreased in the mid-2000s, opening up space for a wider variety of colors and shades. The last few decades came with an explosion of the number of colors, and also the creative possibilities.

Author(s): Edurne Morillo

Publication Date: 27 Jan 2022

Publication Site: Datawrapper

Visualizing the 700-Year Fall of Interest Rates

Link: https://www.visualcapitalist.com/700-year-decline-of-interest-rates/

Graphic:

Excerpt:

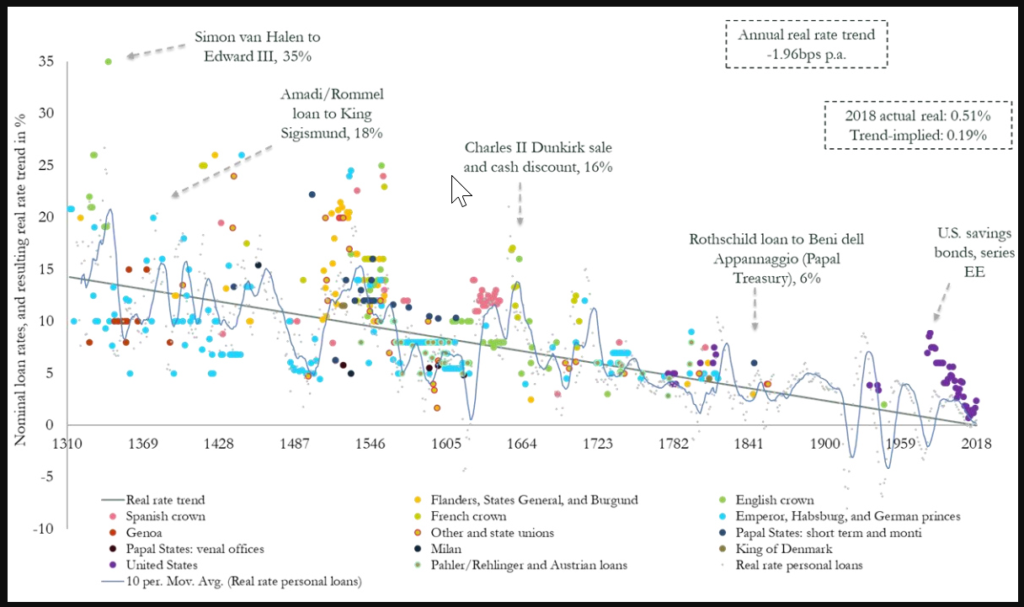
Today’s graphic from Paul Schmelzing, visiting scholar at the Bank of England (BOE), shows how global real interest rates have experienced an average annual decline of -0.0196% (-1.96 basis points) throughout the past eight centuries.

The Evidence on Falling Rates

Collecting data from across 78% of total advanced economy GDP over the time frame, Schmelzing shows that real rates* have witnessed a negative historical slope spanning back to the 1300s.

Displayed across the graph is a series of personal nominal loans made to sovereign establishments, along with their nominal loan rates. Some from the 14th century, for example, had nominal rates of 35%. By contrast, key nominal loan rates had fallen to 6% by the mid 1800s.

Author(s): Dorothy Neufeld

Publication Date: 4 Feb 2020

Publication Site: Visual Capitalist

The Science of Visual Data Communication: What Works

Link: https://journals.sagepub.com/stoken/default+domain/10.1177%2F15291006211051956-FREE/full#.YbpbbYlu2Xw.twitter

doi: https://doi.org/10.1177/15291006211051956

Graphic:

image

Excerpt:

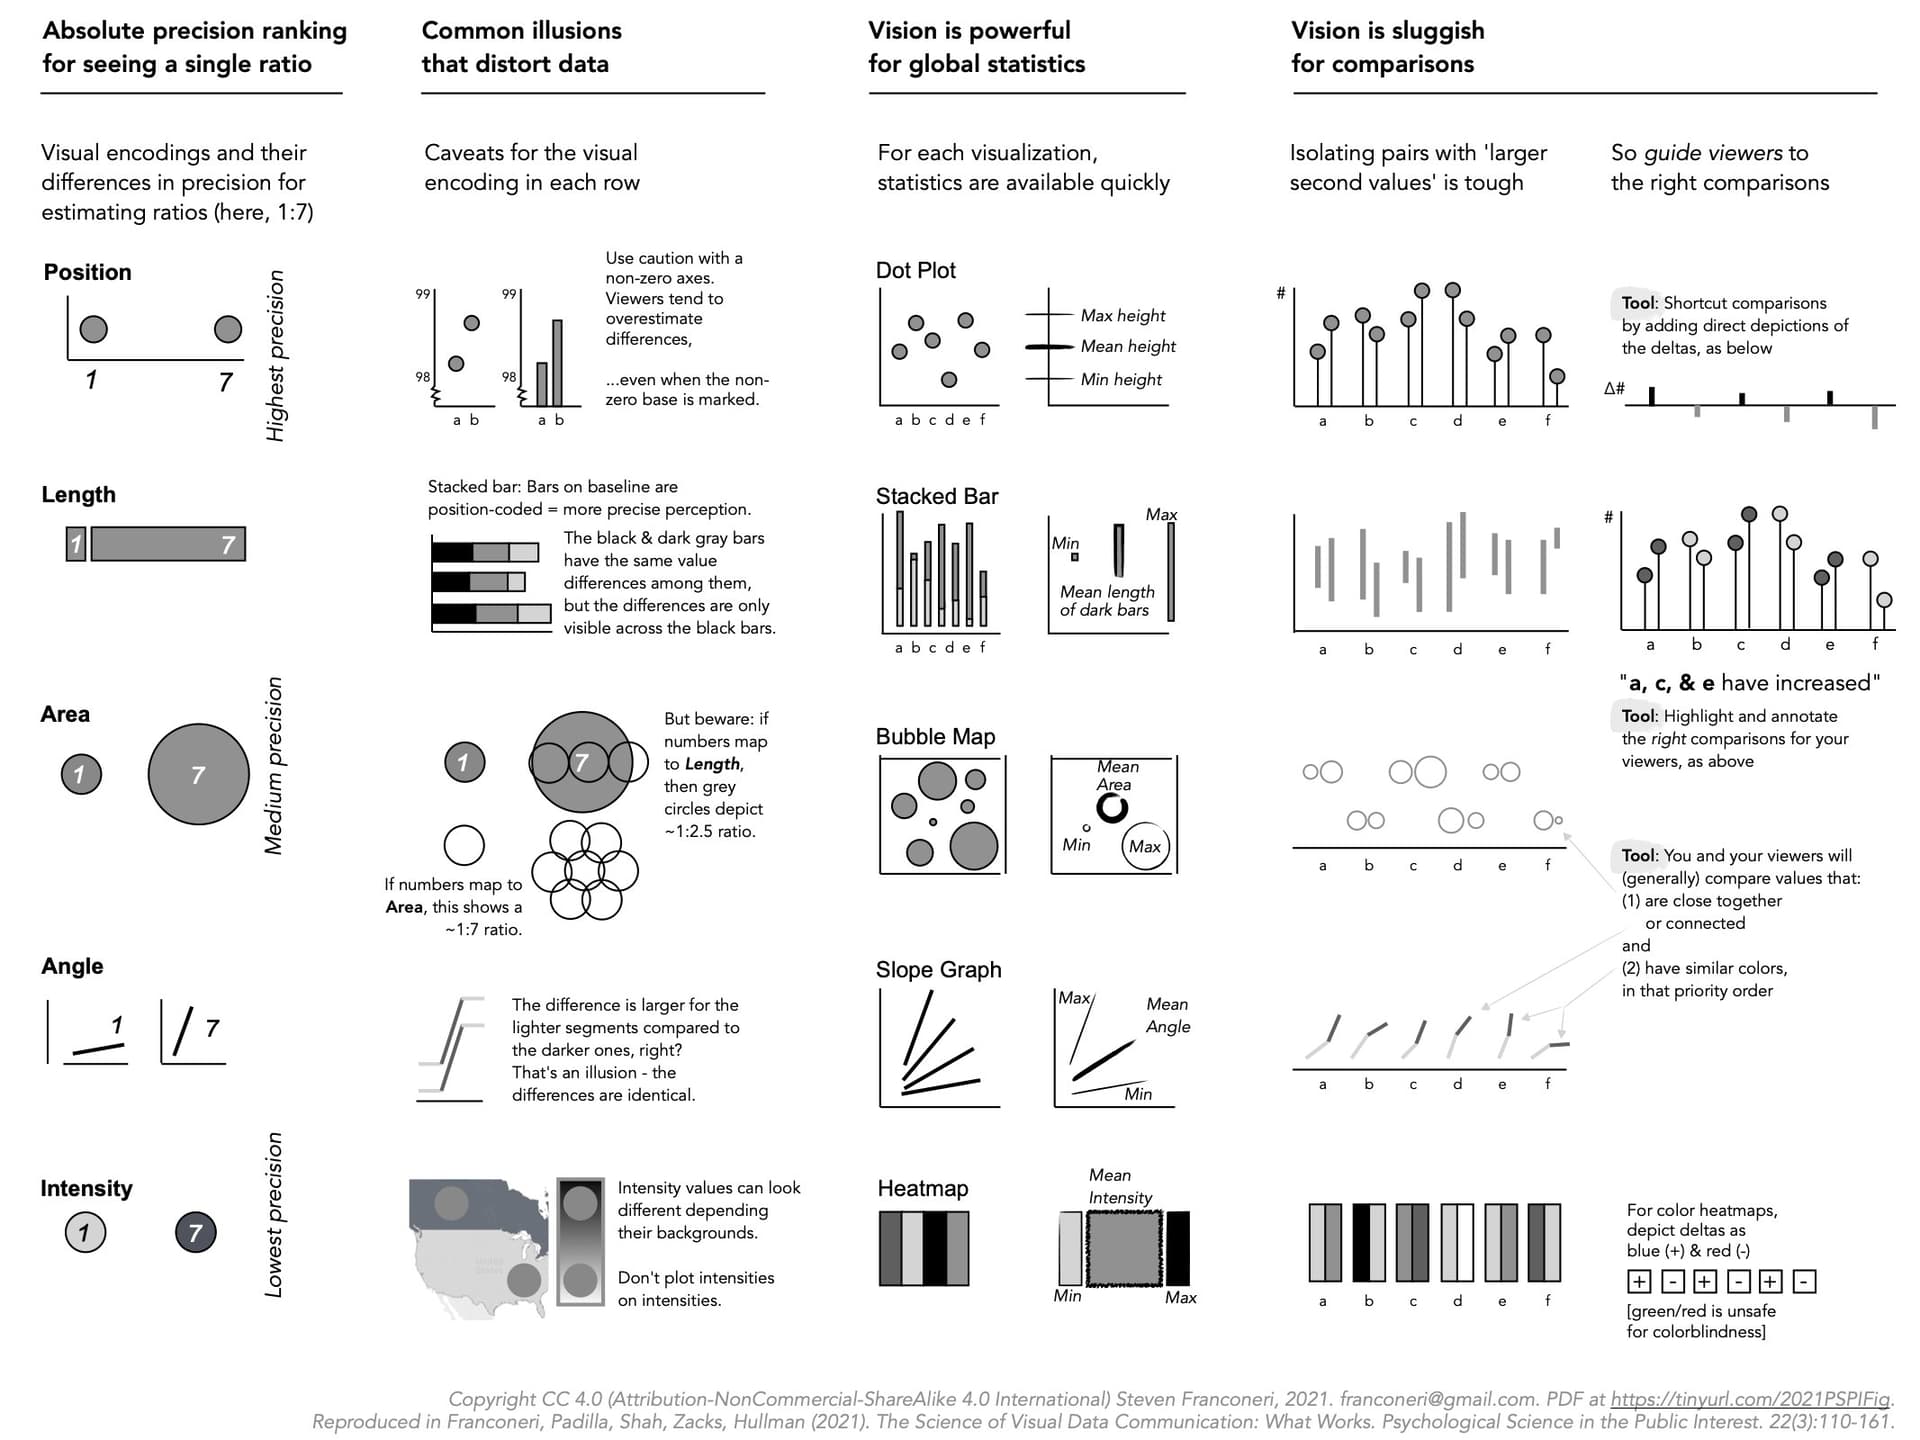
Effectively designed data visualizations allow viewers to use their powerful visual systems to understand patterns in data across science, education, health, and public policy. But ineffectively designed visualizations can cause confusion, misunderstanding, or even distrust—especially among viewers with low graphical literacy. We review research-backed guidelines for creating effective and intuitive visualizations oriented toward communicating data to students, coworkers, and the general public. We describe how the visual system can quickly extract broad statistics from a display, whereas poorly designed displays can lead to misperceptions and illusions. Extracting global statistics is fast, but comparing between subsets of values is slow. Effective graphics avoid taxing working memory, guide attention, and respect familiar conventions. Data visualizations can play a critical role in teaching and communication, provided that designers tailor those visualizations to their audience.

Author(s):
Steven L. Franconeri, Lace M. Padilla, Priti Shah, Jeffrey M. Zacks, Jessica Hullman

Publication Date: 15 Dec 2021

Publication Site: SAGE Journals

Fundamentals of Data Visualization

Link: https://clauswilke.com/dataviz/index.html

Graphic:

Excerpt:

This is the website for the book “Fundamentals of Data Visualization,” published by O’Reilly Media, Inc. The website contains the complete author manuscript before final copy-editing and other quality control. If you would like to order an official hardcopy or ebook, you can do so at various resellers, including Amazon, Barnes and Noble, Google Play, or Powells.

The book is meant as a guide to making visualizations that accurately reflect the data, tell a story, and look professional. It has grown out of my experience of working with students and postdocs in my laboratory on thousands of data visualizations. Over the years, I have noticed that the same issues arise over and over. I have attempted to collect my accumulated knowledge from these interactions in the form of this book.

The entire book is written in R Markdown, using RStudio as my text editor and the bookdown package to turn a collection of markdown documents into a coherent whole. The book’s source code is hosted on GitHub, at https://github.com/clauswilke/dataviz. If you notice typos or other issues, feel free to open an issue on GitHub or submit a pull request. If you do the latter, in your commit message, please add the sentence “I assign the copyright of this contribution to Claus O. Wilke,” so that I can maintain the option of publishing this book in other forms.

Author(s): Claus O. Wilke

Date Accessed: 11 Dec 2021

Publication Site: Claus Wilke’s site
Early data on Omicron show surging cases but milder symptoms

Link:https://www.economist.com/graphic-detail/2021/12/11/early-data-on-omicron-show-surging-cases-but-milder-symptoms?utm_campaign=the-economist-today&utm_medium=newsletter&utm_source=salesforce-marketing-cloud&utm_term=2021-12-09&utm_content=article-link-1&etear=nl_today_1

Graphic:

Excerpt:

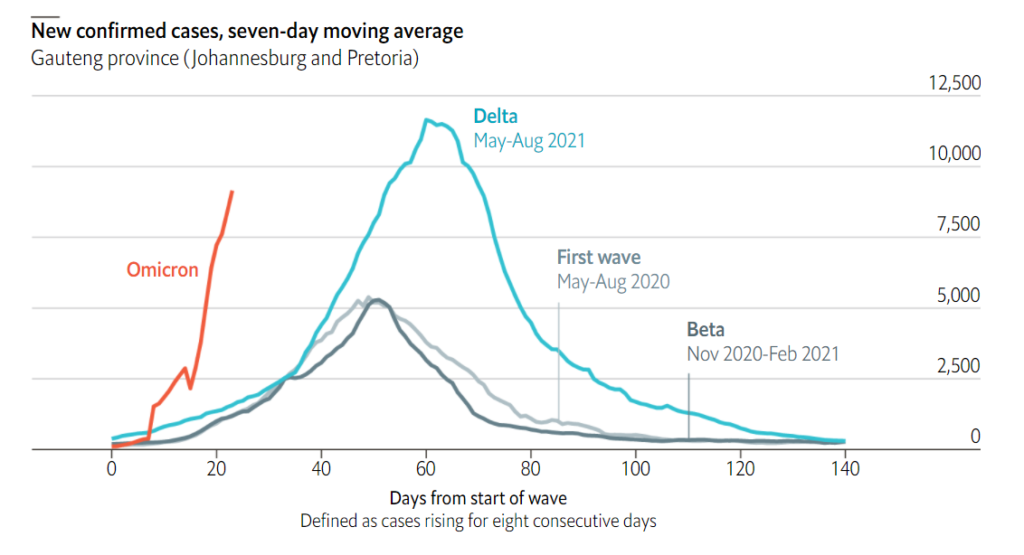
Two weeks after the Omicron variant was identified, hospitals are bracing for a covid-19 tsunami. In South Africa, where it has displaced Delta, cases are rising faster than in earlier waves. Each person with Omicron may infect 3-3.5 others. Delta’s most recent rate in the country was 0.8.

Publication Date: 11 dec 2021

Publication Site: The Economist

COVID cases and deaths are on the rise

Link:https://www.axios.com/covid-cases-deaths-vaccines-omicron-0623380c-e665-435d-a144-4996e74ef5ff.html?mc_cid=0b15989f29&mc_eid=983bcf5922

Graphic:

Excerpt:

Where it stands: The U.S. is now averaging roughly 120,000 new COVID cases per day, a 26% increase over the past two weeks.

Average cases briefly dipped below 100,000 as the summer’s Delta wave receded, but the virus has rebounded quickly. New infections were climbing even before Thanksgiving, and holiday travel likely is accelerating the virus’ spread even further.

Deaths are also on the rise, after tapering off in the fall.

The virus is now killing about 1,300 Americans per day, on average. That’s a 14% increase over the past two weeks.

At this rate, the U.S. will pass 800,000 total deaths — roughly equivalent to the population of the Charleston, South Carolina, metro area — before Christmas.

Author(s): Sam Baker, Kavya Beheraj

Publication Date: 9 Dec 2021

Publication Site: Axios