Consumer Watchdog Calls on Insurance Commissioner Lara to Reject Allstate’s Job-Based Insurance Rate Discrimination, Adopt Regulations to Stop the Practice Industrywide

Link: https://www.prnewswire.com/news-releases/consumer-watchdog-calls-on-insurance-commissioner-lara-to-reject-allstates-job-based-insurance-rate-discrimination-adopt-regulations-to-stop-the-practice-industrywide-301631577.html

Additional: https://consumerwatchdog.org/sites/default/files/2022-09/2022-09-22%20Ltr%20to%20Commissioner%20re%20Allstate%20Auto%20Rate%20Application%20w%20Exhibits.pdf

Graphic:

Excerpt:

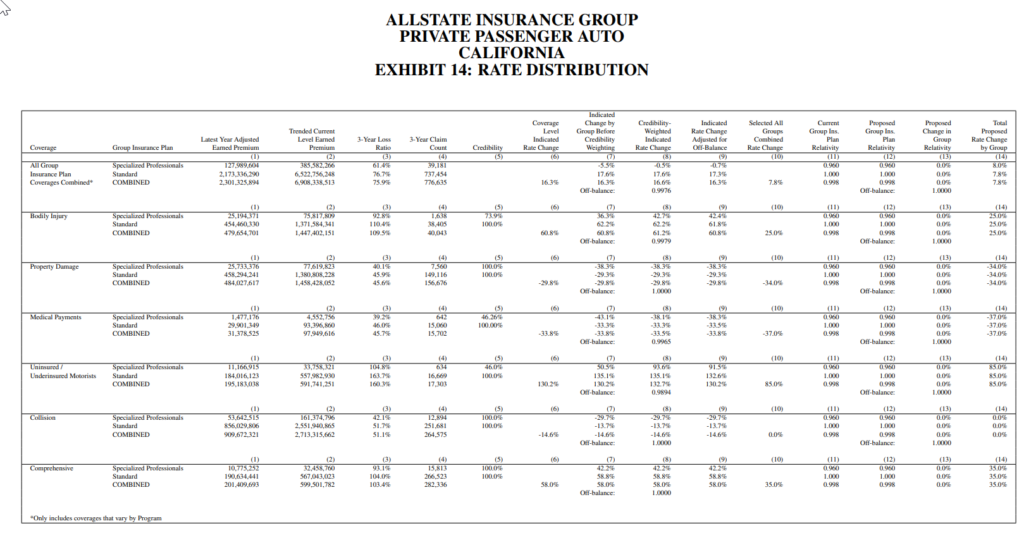
Insurance Commissioner Ricardo Lara should reject Allstate’s proposed $165 million auto insurance rate hike and its two-tiered job- and education-based discriminatory rating system, wrote Consumer Watchdog in a letter sent to the Commissioner today. The group called on the Commissioner to adopt regulations to require all insurance companies industrywide to rate Californians fairly, regardless of their job or education levels, as he promised to do nearly three years ago. Additionally, the group urged the Commissioner to notice a public hearing to determine the additional amounts Allstate owes its customers for premium overcharges during the COVID-19 pandemic, when most Californians were driving less.

Overall, the rate hike will impact over 900,000 Allstate policyholders, who face an average $167 annual premium increase.

Under Allstate’s proposed job-based rating plan, low-income workers such as custodians, construction workers, and grocery clerks will pay higher premiums than drivers in the company’s preferred “professional” occupations, including engineers with a college degree, who get an arbitrary 4% rate reduction.

Author(s): Consumer Watchdog

Publication Date: 22 Sept 2022

Publication Site: PRNewswire

Avoiding Unfair Bias in Insurance Applications of AI Models

Link: https://www.soa.org/resources/research-reports/2022/avoid-unfair-bias-ai/

Report: https://www.soa.org/4a36e6/globalassets/assets/files/resources/research-report/2022/avoid-unfair-bias-ai.pdf

Graphic:

Excerpt:

Artificial intelligence (“AI”) adoption in the insurance industry is increasing. One known risk as adoption of AI increases is the potential for unfair bias. Central to understanding where and how unfair bias may occur in AI systems is defining what unfair bias means and what constitutes fairness.

This research identifies methods to avoid or mitigate unfair bias unintentionally caused or exacerbated by the use of AI models and proposes a potential framework for insurance carriers to consider when looking to identify and reduce unfair bias in their AI models. The proposed approach includes five foundational principles as well as a four-part model development framework with five stage gates.

Smith, L.T., E. Pirchalski, and I. Golbin. Avoiding Unfair Bias in Insurance Applications of AI Models. Society of Actuaries, August 2022.

Author(s):

Logan T. Smith, ASA
Emma Pirchalski
Ilana Golbin

Publication Date: August 2022

Publication Site: SOA Research Institute

What can go wrong? Exploring racial equity dataviz and deficit thinking, with Pieta Blakely.

Link: https://3iap.com/what-can-go-wrong-racial-equity-data-visualization-deficit-thinking-VV8acXLQQnWvvg4NLP9LTA/

Graphic:

Excerpt:

For anti-racist dataviz, our most effective tool is context. The way that data is framed can make a very real impact on how it’s interpreted. For example, this case study from the New York Times shows two different framings of the same economic data and how, depending on where the author starts the X-Axis, it can tell 2 very different — but both accurate — stories about the subject.

As Pieta previously highlighted, dataviz in spaces that address race / ethnicity are sensitive to “deficit framing.” That is, when it’s presented in a way that over-emphasizes differences between groups (while hiding the diversity of outcomes within groups), it promotes deficit thinking (see below) and can reinforce stereotypes about the (often minoritized) groups in focus.

In a follow up study, Eli and Cindy Xiong (of UMass’ HCI-VIS Lab) confirmed Pieta’s arguments, showing that even “neutral” data visualizations of outcome disparities can lead to deficit thinking (and therefore stereotyping) and that the way visualizations are designed can significantly impact these harmful tendencies.

Author(s): Eli Holder, Pieta Blakely

Publication Date: 2 Aug 2022

Publication Site: 3iap

“Dispersion & Disparity” Research Project Results

Link: https://3iap.com/dispersion-disparity-equity-centered-data-visualization-research-project-Wi-58RCVQNSz6ypjoIoqOQ/

Graphic:

The same dataset, visualized two different ways. The left fixates on between-group differences, which can encourage stereotyping. The right shows both between and within group differences, which may discourage viewers’ tendencies to stereotype the groups being visualized.

Excerpt:

Ignoring or deemphasizing uncertainty in dataviz can create false impressions of group homogeneity (low outcome variance). If stereotypes stem from false impressions of group homogeneity, then the way visualizations represent uncertainty (or choose to ignore it) could exacerbate these false impressions of homogeneity and mislead viewers toward stereotyping.

If this is the case, then social-outcome-disparity visualizations that hide within-group variability (e.g. a bar chart without error bars) would elicit more harmful stereotyping than visualizations that emphasize within-group variance (e.g. a jitter plot).

Author(s): Stephanie Evergreen

Publication Date: 2 Aug 2022

Publication Site: 3iap

Tiny Python Projects

Link: http://tinypythonprojects.com/Tiny_Python_Projects.pdf

Graphic:

Excerpt:


The biggest barrier to entry I’ve found when I’m learning a new language is that small concepts of the language are usually presented outside of any useful context. Most programming language tutorials will start with printing “HELLO, WORLD!” (and this is book is no exception). Usually that’s pretty simple. After that, I usually struggle to write a complete program that will accept some arguments and do something useful.

In this book, I’ll show you many, many examples of programs that do useful things, in the hopes that you can modify these programs to make more programs for your own use.

More than anything, I think you need to practice. It’s like the old joke: “What’s the way to Carnegie Hall? Practice, practice, practice.” These coding challenges are short enough that you could probably finish each in a few hours or days. This is more material than I could work through in a semester-long university-level class, so I imagine the whole book will take you several months. I hope you will solve the problems, then think about them, and then return later to see if you can solve them differently, maybe using a more advanced technique or making them run faster.

Author(s): Ken Youens-Clark

Publication Date: 2020

Publication Site: Tiny Python Projects

Fitting Yield Curves to rates

Link: https://juliaactuary.org/tutorials/yield-curve-fitting/

Graphic:

Excerpt:

Given rates and maturities, we can fit the yield curves with different techniques in Yields.jl.

Below, we specify that the rates should be interpreted as Continuously compounded zero rates:

using Yields

rates = Continuous.([0.01, 0.01, 0.03, 0.05, 0.07, 0.16, 0.35, 0.92, 1.40, 1.74, 2.31, 2.41] ./ 100)
mats = [1/12, 2/12, 3/12, 6/12, 1, 2, 3, 5, 7, 10, 20, 30]

Then fit the rates under four methods:

  • Nelson-Siegel
  • Nelson-Siegel-Svennson
  • Boostrapping with splines (the default Bootstrap option)
  • Bootstrapping with linear splines
ns =  Yields.Zero(NelsonSiegel(),                   rates,mats)
nss = Yields.Zero(NelsonSiegelSvensson(),           rates,mats)
b =   Yields.Zero(Bootstrap(),                      rates,mats)
bl =  Yields.Zero(Bootstrap(Yields.LinearSpline()), rates,mats)

That’s it! We’ve fit the rates using four different techniques. These can now be used in a variety of ways, such as calculating the present_valueduration, or convexity of different cashflows if you imported ActuaryUtilities.jl

Publication Date: 19 Jun 2022, accessed 22 Jun 2022

Publication Site: JuliaActuary

Evaluating Unintentional Bias in Private Passenger Automobile Insurance

Link: https://disb.dc.gov/page/evaluating-unintentional-bias-private-passenger-automobile-insurance

Public Hearing Notice: Evaluating Unintentional Bias in Private Passenger Automobile Insurance, June 29, 2022, 3 pm

Excerpt:

In 2020, Commissioner Karima Woods, Commissioner for the District of Columbia Department of Insurance, Securities and Banking (DISB) directed the creation of the Department’s first Diversity Equity and Inclusion Committee to engage in a wide-ranging review of financial equity and inclusion and to make recommendations to remove barriers to accessing financial services. Department staff developed draft initiatives, including an initiative related to insurers’ use of factors such as credit scores, education, occupation, home ownership and marital status in underwriting and ratemaking. Stakeholder feedback on this draft initiative resulted in the Department concluding that data was necessary to properly address this initiative. Department staff conducted research and contacted subject matter experts before determining that relevant data was not generally available.

The Department is undertaking this project to collect the relevant data. We determined this initiative will be deliberative and transparent to ensure the resultant data would address the issue of unintentional bias. We also decided to initially focus on private passenger automobile insurance as that is a line of insurance that affects many District consumers and has previously had questions raised about the use of non-driving factors. The collected data will build on previous work done by the Department through the 2018 and 2019 public hearings and examinations that looked at private passenger automobile insurance ratemaking methodologies.

For this project to look at the potential for unintentional bias in auto insurance, DISB will conduct a review of auto insurers’ rating and underwriting methodologies. As a first step, DISB will hold a public hearing on Wednesday, June 29, 2022 at 3 pm to gather stakeholder input on the review plan, which is outlined below. The Department has engaged the services of O’Neil Risk Consulting and Algorithmic Auditing (ORCAA) to assist the Department and provide subject matter expertise. Additionally, the Department will hold one or more meetings to follow up on any items raised during the public hearing.

Publication Date: accessed 18 Jun 2022

Publication Site: District of Columbia Department of Insurance, Securities & Banking

A New Estimate of the Average Earth Surface Land Temperature Spanning 1753 to 2011

Link: https://static.berkeleyearth.org/papers/Results-Paper-Berkeley-Earth.pdf

Graphic:

Abstract:

We report an estimate of the Earth’s average land surface temperature for the period 1753 to 2011. To address issues of potential station selection bias, we used a larger sampling of stations than had prior studies. For the period post 1880, our estimate is similar to those previously reported by other groups,
although we report smaller uncertainties. The land temperature rise from the 1950s decade to the 2000s decade is 0.90 ± 0.05°C (95% confidence). Both maximum and minimum temperatures have increased during the last century. Diurnal variations decreased from 1900 to 1987 and then increased; this increase is significant but not understood. The period of 1753 to 1850 is marked by sudden drops in land surface temperature that are coincident with known volcanism; the response function is approximately
1.5 ± 0.5°C per 100 Tg of atmospheric sulfate. This volcanism, combined with a simple proxy for anthropogenic effects (logarithm of the CO2 addition of a solar forcing term. Thus, for this very simple model, solar forcing does not appear to contribute to the observed global warming of the past 250 years; the entire change can be modeled by a sum of volcanism and a single anthropogenic proxy. The residual variations include interannual and multi-decadal variability very similar to that of the Atlantic Multidecadal Oscillation (AMO).


Keywords: Global warming; Kriging; Atlantic multidecadal oscillation;
Amo; Volcanism; Climate change; Earth surface temperature; Diurnal
variability

Author(s):

Robert Rohde1
, Richard A. Muller1,2,3
*, Robert Jacobsen2,3
,
Elizabeth Muller1
, Saul Perlmutter2,3
, Arthur Rosenfeld2,3
,
Jonathan Wurtele2,3
, Donald Groom3
and Charlotte Wickham4

Citation:

Rohde et al., Geoinfor Geostat: An Overview 2013, 1:1
http://dx.doi.org/10.4172/2327-4581.1000101

Publication Date: 2013

Publication Site: Geoinformatics & Geostatistics: An Overview

The Berkeley Earth Land/Ocean Temperature Record

Link: https://essd.copernicus.org/articles/12/3469/2020/essd-12-3469-2020.html

Graphic:

Abstract:

A global land–ocean temperature record has been created by combining the Berkeley Earth monthly land temperature field with spatially kriged version of the HadSST3 dataset. This combined product spans the period from 1850 to present and covers the majority of the Earth’s surface: approximately 57 % in 1850, 75 % in 1880, 95 % in 1960, and 99.9 % by 2015. It includes average temperatures in 1∘×1∘ lat–long grid cells for each month when available. It provides a global mean temperature record quite similar to records from Hadley’s HadCRUT4, NASA’s GISTEMP, NOAA’s GlobalTemp, and Cowtan and Way and provides a spatially complete and homogeneous temperature field. Two versions of the record are provided, treating areas with sea ice cover as either air temperature over sea ice or sea surface temperature under sea ice, the former being preferred for most applications. The choice of how to assess the temperature of areas with sea ice coverage has a notable impact on global anomalies over past decades due to rapid warming of air temperatures in the Arctic. Accounting for rapid warming of Arctic air suggests ∼ 0.1 C additional global-average temperature rise since the 19th century than temperature series that do not capture the changes in the Arctic. Updated versions of this dataset will be presented each month at the Berkeley Earth website (http://berkeleyearth.org/data/, last access: November 2020), and a convenience copy of the version discussed in this paper has been archived and is freely available at https://doi.org/10.5281/zenodo.3634713 (Rohde and Hausfather, 2020).

Author(s): Robert A. Rohde1 and Zeke Hausfather1,2

Citation:
Rohde, R. A. and Hausfather, Z.: The Berkeley Earth Land/Ocean Temperature Record, Earth Syst. Sci. Data, 12, 3469–3479, https://doi.org/10.5194/essd-12-3469-2020, 2020.

Publication Date: 17 Dec 2020

Publication Site: Earth System Science Data

Big Data, Big Discussions

Link: https://theactuarymagazine.org/big-data-big-discussions/

Excerpt:

Why is the insurance industry now facing increased scrutiny on certain underwriting methods?

Insurers increasingly are turning to nontraditional data sets, sources and scores. The methods used to obtain traditional data—that were at one time costly and time-consuming—can now be done quickly and cheaply.

As insurers continue to innovate their underwriting techniques, increased scrutiny should be expected. It is not unreasonable for consumer advocates to push for increased transparency and explainability when insurers employ these advanced methods.

What is the latest regulatory activity on this topic in the various states and at the NAIC?

Activity in the states has been minimal. In 2021, Colorado became the first (and so far, only) state to enact legislation requiring insurers to test their algorithms for bias. Legislation nearly identical to the Colorado law was introduced in Oklahoma and Rhode Island in 2022, and it is likely other states will consider similar legislation. Connecticut is finalizing guidance that would require insurers to attest that their use of data is nondiscriminatory. Other states have targeted specific factors, but most have adopted a wait-and-see approach.

The NAIC created a new high-level committee to focus on innovation and AI, but it has become clear that a national standard is not likely at this time.

Author(s): INTERVIEW BY STEPHEN ABROKWAH, Interview with Neil Sprackling, president of Swiss Re Life & Health America Inc.

Publication Date: March 2022

Publication Site: The Actuary

CAS Releases Two Additional Papers in Race and Insurance Pricing Series

Link: https://www.casact.org/article/cas-releases-two-additional-papers-race-and-insurance-pricing-series

Excerpt:

Arlington, VA – Two new research reports designed to guide the insurance industry toward proactive, quantitative solutions to identify, measure and address potential racial bias in insurance pricing were published by the Casualty Actuarial Society (CAS) today.

“These two new reports in our CAS Research Series on Race and Insurance Pricing continue to provide additional insight into industry discussions on this topic,” said Victor Carter-Bey, DM, CAS chief executive officer. “We hope with this series to serve as a thought leader and role model for other insurance organizations and corporations in promoting fairness and progress.”

As the professional society of actuaries specializing in property and casualty insurance, the CAS is committed to diversity, equity and inclusion in actuarial work. To this end, the Society is releasing a series of four CAS Research Papers, which support the CAS’s Approach to Race and Insurance Pricing. This approach was adopted by the CAS Board of Directors in December 2020 and includes four key areas of focus and goals: basic and continuing education, research, leadership and influence, and collaboration. Each paper in the series addresses a different aspect of race and insurance pricing as viewed through the lens of property and casualty insurance.

Two of the four reports in the CAS Research Paper Series on Race and Insurance PricingUnderstanding Potential Influences of Racial Bias on P&C Insurance: Four Rating Factors Explored and Defining Discrimination in Insurance, are being released today. Here is a more detailed description of the two reports published today:

Defining Discrimination in InsuranceThis report examines terms that are being used in discussions around potential discrimination in insurance, including protected class, unfair discrimination, proxy discrimination, disparate impact, disparate treatment, and disproportionate impact. The paper provides historical and practical context for these terms and illustrates the inconsistencies in how different stakeholders define them. It also describes the potential impacts of these definitions on actuarial work.

Understanding Potential Influences of Racial Bias on P&C Insurance: Four Rating Factors ExploredThe paper examines four commonly used rating factors to understand how the data underlying insurance pricing models may be impacted by racially biased policies and practices outside of insurance. The goal is to highlight the multi-dimensional impacts of systemic racial bias, as it may relate to insurance pricing. The four factors included in the report are: Credit-Based Insurance Score (CBIS), geographic location, homeownership and Motor Vehicle Records.

The other two reports, Methods for Quantifying Discriminatory Effects on Protected Classes in Insuranceand Approaches to Address Racial Bias in Financial Services: Lessons for the Insurance Industry, were released March 10, 2022 during a virtual briefing.  

These four research reports are just one way the CAS supports evolving actuarial practices and strengthens the knowledge of its members. The papers demonstrate the Society’s recognition that actuaries—who are responsible for setting insurance rates—must be a voice in an ever-evolving dialogue. The CAS understands that this work is critical to maintaining the Society and its members’ public trust.

Publication Date: 31 Mar 2022

Publication Site: CAS

The EEOC wants to make AI hiring fairer for people with disabilities

Link: https://www.brookings.edu/blog/techtank/2022/05/26/the-eeoc-wants-to-make-ai-hiring-fairer-for-people-with-disabilities/

Excerpt:

That hiring algorithms can disadvantage people with disabilities is not exactly new information. In 2019, for my first piece at the Brookings Institution, I wrote about how automated interview software is definitionally discriminatory against people with disabilities. In a broader 2018 review of hiring algorithms, the technology advocacy nonprofit Upturn concluded that “without active measures to mitigate them, bias will arise in predictive hiring tools by default” and later notes this is especially true for those with disabilities. In their own report on this topic, the Center for Democracy and Technology found that these algorithms have “risk of discrimination written invisibly into their codes” and for “people with disabilities, those risks can be profound.” This is to say that there has long been broad consensus among experts that algorithmic hiring technologies are often harmful to people with disabilities, and that given that as many as 80% of businesses now use these tools, this problem warrants government intervention.

….

The EEOC’s concerns are largely focused on two problematic outcomes: (1) algorithmic hiring tools inappropriately punish people with disabilities; and (2) people with disabilities are dissuaded from an application process due to inaccessible digital assessments.

Illegally “screening out” people with disabilities

First, the guidance clarifies what constitutes illegally “screening out” a person with a disability from the hiring process. The new EEOC guidance presents any disadvantaging effect of an algorithmic decision against a person with a disability as a violation of the ADA, assuming the person can perform the job with legally required reasonable accommodations. In this interpretation, the EEOC is saying it is not enough to hire candidates with disabilities in the same proportion as people without disabilities. This differs from EEOC criteria for race, religion, sex, and national origin, which says that selecting candidates at a significantly lower rate from a selected group (say, less than 80% as many women as men) constitutes illegal discrimination.

Author(s): Alex Engler

Publication Date: 26 May 2022

Publication Site: Brookings