Link: https://www.tableau.com/about/blog/2021/2/data-science-and-future-visualization-tools-reflection
Graphic:
Excerpt:
Importantly, a working definition of data science narrows the scope of research. Instead of considering all possible types of data analysis that one may wish to conduct, we look closely at the types of analyses data scientists carry out. This distinction is important as the specific steps that, say, an experimental physicist takes to analyze data are different, even though they share commonalities, than the analytic steps a data scientist may take. Which leads to an important follow on: what exactly is data science work?
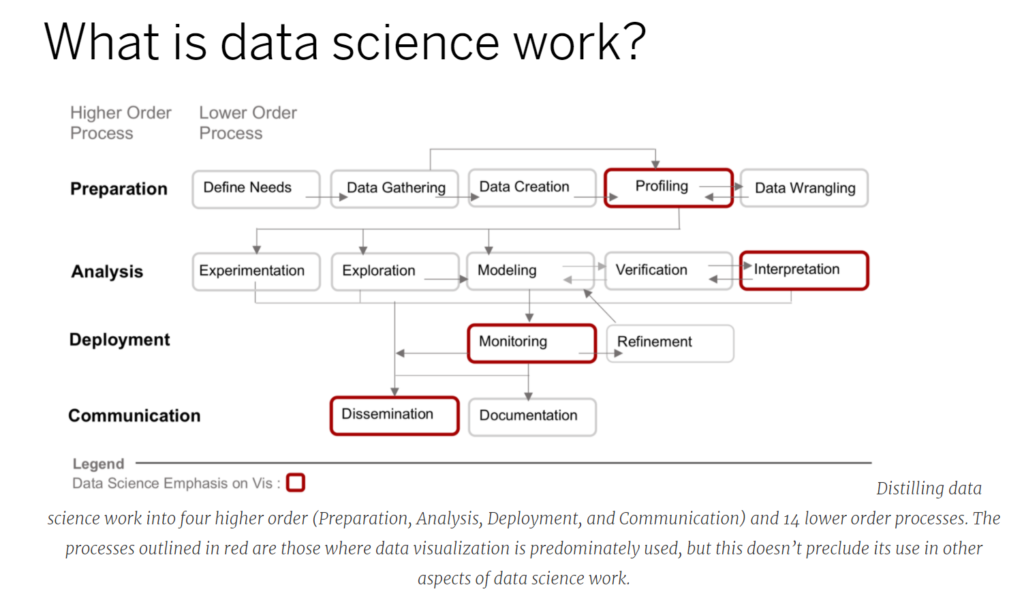
There have been several industry standards for breaking down data science work. The first was the KDD (or Knowledge in Data Discovery) method, that over time was modified and expanded upon by others. From these derivations, as well as studies that interview data scientists, we created a framework that has four higher order processes (preparation, analysis, deployment, and communication) and 14 lower order processes. Using the red stroke outline we also highlighted the specific areas where data visualization already plays a prominent role in data science work. In our research article we provide detailed definitions and examples of these processes.
Author(s): ANA CRISAN
Publication Date: 24 February 2021
Publication Site: Tableau