Excerpt:
We analyzed all deaths from 1999 to 2023 in which the International Statistical Classification of Diseases and Related Health Problems, 10th Revision code was P81 (environmental hyperthermia of newborn), T67 (effects of heat and light), or X30 (exposure to excessive natural heat) as either the underlying cause or as a contributing cause of death, as recorded in the Multiple Cause of Death file. Data were accessed through the Centers for Disease Control and Prevention’s WONDER platform,5 which combines death counts with population estimates produced by the US Census Bureau to calculate mortality rates. For each year, we extracted age-adjusted mortality rates (AAMRs) per 100 000 person-years for heat-related deaths. The AAMR accounts for differences due to age structures, allowing direct comparisons across time. The approach of analyzing cause-specific mortality rates rather than excess mortality is warranted because the excess mortality methodology is subject to confounding from the COVID-19 pandemic from 2020 to 2023. This study used publicly available, deidentified aggregate data; thus, it was not considered human subjects research.
Joinpoint version 5.2.0 (National Cancer Institute) regression6 was used to analyze AAMRs to assess trends and determine elbow points where the trend began to shift to a new trajectory. Results of joinpoint analyses are reported as average annual percentage change (AAPC) in rates with 95% CIs. Statistical significance was defined as 2-sided P < .05. Data were visualized with R version 4.2.2 (R Foundation for Statistical Computing).
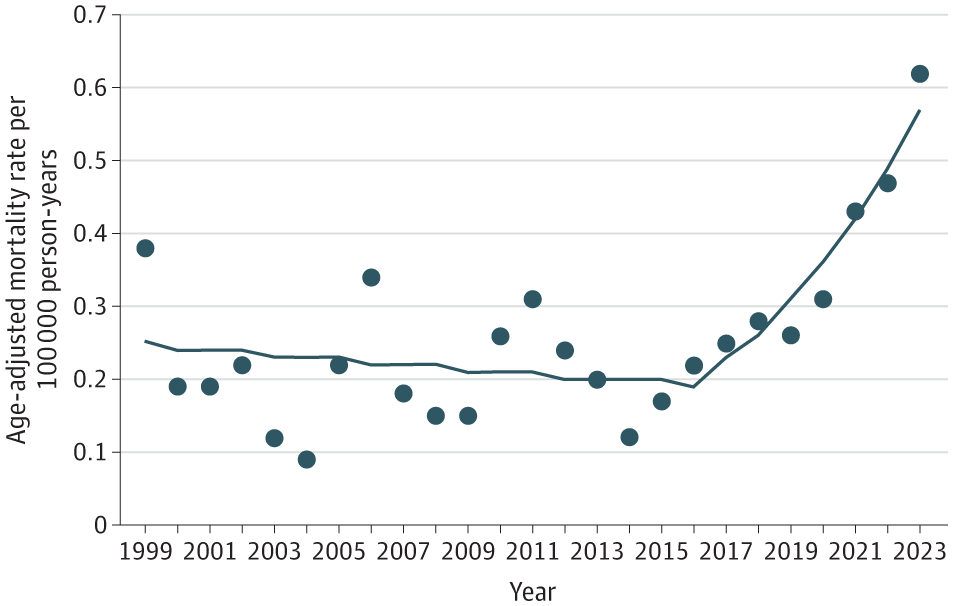
From 1999 to 2023, 21 518 deaths were recorded as heat-related underlying or contributing cause of death, with an AAMR of 0.26 per 100 000 person-years (95% CI, 0.24-0.27) (Table). The number of heat-related deaths increased from 1069 (AAMR = 0.38; 95% CI, 0.36-0.40) in 1999 to 2325 (AAMR = 0.62; 95% CI, 0.60-0.65) in 2023, a 117% increase in the number of heat-related deaths and a 63% increase in the AAMR. The lowest number of heat-related deaths in the study period was 311 in 2004, whereas the highest, 2325, was in 2023.
Results of the joinpoint trend analysis showed that during the entire period, the AAMR increased by 3.6% per year (AAPC = 3.6%; 95% CI, 0.1%-7.2%; P = .04) from 1999 to 2023 (Figure). The number of heat-related deaths and AAMR showed year-to-year variability, with spikes in 2006 and 2011, before showing steady increases after 2016. Joinpoint results showed a nonsignificant decrease of 1.4% per year from 1999 to 2016 (AAPC = −1.4%; 95% CI, −4.7% to 2.1%; P = .42), followed by a significant increase of 16.8% per year in the AAMR from 2016 to 2023 (AAPC = 16.8%; 95% CI, 6.4%-28.2%; P = .002).
Author(s): Jeffrey T. Howard, PhD1; Nicole Androne, MS1; Karl C. Alcover, PhD2; et al
Publication Date: Published online August 26, 2024
`
Publication Site: JAMA Networkdoi:10.1001/jama.2024.16386