Association of Cardiovascular Health With Life Expectancy Free of Cardiovascular Disease, Diabetes, Cancer, and Dementia in UK Adults

Link: https://jamanetwork.com/journals/jamainternalmedicine/article-abstract/2801750?guestAccessKey=9c49772f-a1bb-4a29-9a46-445f585b3781&utm_source=silverchair&utm_medium=email&utm_campaign=article_alert-jamainternalmedicine&utm_content=olf&utm_term=022723

Cite: JAMA Intern Med. Published online February 27, 2023. doi:10.1001/jamainternmed.2023.0015

Graphic:

Excerpt:

Question  What is the association of cardiovascular health (CVH) levels, estimated by the American Heart Association’s Life’s Essential 8 score, with life expectancy free of major chronic diseases?

Findings  In this cohort study of 135 199 adults from the UK Biobank study, high CVH level was associated with substantially longer life expectancy free of 4 major chronic diseases (cardiovascular disease, diabetes, cancer, and dementia) in both men and women. Furthermore, the disease-free life expectancy was similar between low and other socioeconomic groups among participants with high CVH.

Meaning  These findings support improvement in population health by promoting a high CVH level, which may also narrow health disparities associated with socioeconomic status.

Author(s): Xuan Wang, MD, PhD1; Hao Ma, MD, PhD1; Xiang Li, MD, PhD1; et al

Publication Date: 27 Feb 2023

Publication Site: JAMA Internal Medicine

Why the life insurance industry did not face an “S&L-type” crisis

Link: https://econpapers.repec.org/article/fipfedhep/y_3a1993_3ai_3asep_3ap_3a12-24_3an_3av.17no.5.htm

PDF link: https://econpapers.repec.org/scripts/redir.pf?u=http%3A%2F%2Fwww.chicagofed.org%2Fdigital_assets%2Fpublications%2Feconomic_perspectives%2F1993%2Fep_sep_oct1993_part2_brewer.pdf;h=repec:fip:fedhep:y:1993:i:sep:p:12-24:n:v.17no.5

Full reference:

Elijah BrewerThomas H. Mondschean and Philip E. Strahan

Economic Perspectives, 1993, vol. 17, issue Sep, 12-24

Graphic:

Excerpt:

In most states, coverage under guaranty

funds is $300,000 in death benefits, $100,000 in

cash or withdrawal value for life insurance,

$100,000 in present value of annuity benefits,

and $100,000 in health benefits. Some states

cover all insurance policies written by an insol-

vent firm located in the state; others cover the

policies of residents only. In the case of unallo-

cated annuities such as GICs purchased by com-

panies to fund pension plans, some states cover

up to a certain amount, usually $5 million. Oth-

er states, such as California, Massachusetts, and

Missouri, do not cover GICs.

Because of variations in state guaranty

funds and in the way insolvencies are handled,

the parties bearing the costs of an insurance

failure differ across states. Surviving insurance

companies initially pay their assessments and

claim them as an expense on their federal corpo-

rate income tax return, reducing their federal

income taxes. As companies receive tax credits

in subsequent years, these credits become tax-

able income. As a result, the federal government

bears part of the cost of an insolvency since it

does not fully recover the present value of the

tax decrease granted in the assessment year. In

states with premium tax offsets, however, the

majority of the cost is paid by state taxpayers.

A study of 1990 life/health guaranty fund assess-

ments found that 73.6 percent was paid by state

taxpayers, 8.9 percent by federal taxpayers, and

17.5 percent by the equity holders of the surviv-

ing firms.

Author(s): Elijah BrewerThomas H. Mondschean and Philip E. Strahan

Publication Date: September 1993

Publication Site: Economic Perspectives, Chicago Fed

An Update on America’s Homicide Surge

Link: https://www.city-journal.org/update-on-americas-homicide-surge

Graphic:

Excerpt:

Last year, Christos Makridis and I used homicide data from the Centers for Disease Control to break down the 2020 homicide spike by geography and demographics. With another year’s worth of numbers now finalized—plus “provisional” numbers stretching into 2022—it’s time for a brief update. The CDC’s data, compiled from death certificates, are especially crucial in a year when the FBI completely failed to collect murder data from many of the nation’s police departments.

The good news is that, after spiking in 2020 and rising a little further in 2021, homicides seem to be falling again. The bad news is that this has been an extremely slow process, with recent numbers still well above pre-2020 levels, even if violence remains far from the sky-high levels of the early 1990s.

The CDC puts the national homicide rate at 7.8 per 100,000 for 2021, versus 7.5 for 2020 and 5.8 for 2019. Here are the month-by-month totals since 2018, including provisional data for the first half of 2022:

Author(s): Robert VerBruggen

Publication Date: 25 Jan 2023

Publication Site: City Journal

Under-five mortality

Link: https://data.unicef.org/topic/child-survival/under-five-mortality/

Graphic:

Excerpt:

The world made remarkable progress in child survival in the past three decades, and millions of children have better survival chances than in 1990—1 in 26 children died before reaching age five in 2021, compared to 1 in 11 in 1990. Moreover, progress in reducing child mortality rates has been accelerated in the 2000s period compared with the 1990s, with the annual rate of reduction in the global under-five mortality rate increasing from 1.8 per cent in 1990s to 4.0 per cent for 2000-2009 and 2.7 per cent for 2010-2021.

Under-five mortality

The under-five mortality rate refers to the probability a newborn would die before reaching exactly 5 years of age, expressed per 1,000 live births. In 2021, 5.0 million children under 5 years of age died. Globally, infectious diseases, including pneumonia, diarrhoea and malaria, remain a leading cause of under-five deaths, along with preterm birth and intrapartum-related complications.

The global under-five mortality rate declined by 59 per cent, from 93 deaths per 1,000 live births in 1990 to 38 in 2021. Despite this considerable progress, improving child survival remains a matter of urgent concern. In 2021 alone, roughly 13,800 under-five deaths occurred every day, an intolerably high number of largely preventable child deaths.

Publication Date: January 2023, accessed 21 March 2023

Publication Site: UNICEF

Group Life COVID-19 Mortality Survey – Updated through September 2021

Link: https://www.soa.org/resources/experience-studies/2022/group-life-covid-19-mortality/

Report PDF: https://www.soa.org/48ff80/globalassets/assets/files/resources/research-report/2022/group-life-covid-19-mortality.pdf

Graphic:

Excerpt:

Table 5.2 shows more detailed industry results for the top ten industry segments by number of COVID claims. Most of these industries were in the top ten for the July 2021 report as well. As we now have more quarters with more complete results, both the A/E ratios for April 2020 through September 2021, as well as the COVID claims as a percentage of baseline claims, showed greater consistency across industries than in the previous report. Public Administration continues to be a key driver of high A/E ratios for the White Collar category. Doctors (Healthcare, also White Collar), Retail Trade (Grey Collar), and Misc. Services (Grey Collar) have the highest COVID claims as a percentage of baseline claims. Heavy Steel Manufacturing (Blue Collar) has a much lower A/E ratio than the other top 10 industries. In the table below, “B,” “W,” and “G” refer to Blue Collar, White Collar, and Grey Collar, respectively.

It should be noted that the high A/E ratios for Public Administration are driven by experience in the Executive, Legislative, and General Government segment (Standard Industry Classification [SIC] codes 9100-9199). This segment does not include police and fire and represents over 85% of claims in the broader Public Administration segment.

Video:

Publication Date: January 2022

Publication Site: Society of Actuaries Research Institute

Child Mortality Rate, under age five – doc v11

Link: https://www.gapminder.org/data/documentation/gd005/

Graphic:

Excerpt:

Documentation — version 11

This page describes how Gapminder has combined data from multiple sources into one long coherent dataset with Child mortality under age 5, for all countries for all years between 1800 to 2100.

Data » Online spreadsheet with data for countries, regions and global total — v11

SUMMARY DOCUMENTATION OF V11

Sources

— 1800 to 1950: Gapminder v7  (In some cases this is also used for years after 1950, see below.) This was compiled and documented by Klara Johansson and Mattias Lindgren from many sources but mainly based on www.mortality.org and the series of books called International Historical Statistics by Brian R Mitchell, which often have historic estimates of Infant mortality rate which were converted to Child mortality through regression. See detailed documentation of v7 below.

— 1950 to 2016: UNIGME, is a data collaboration project between UNICEF, WHO, UN Population Division and the World Bank. They released new estimates of child mortality for countries and a global estimate on September 19, 2019, and the data is available at www.childmortality.org. In this dataset, 70% of all countries have estimates between 1970 and 2018, while roughly half the countries also reach back to 1960 and 17% reach back to 1950.

— 1950 to 2100: UN POPWorld Population Prospects 2019 provides annual data for Child mortality rate for all countries in the annually interpolated demographic indicators, called WPP2019_INT_F01_ANNUAL_DEMOGRAPHIC_INDICATORS.xlsx, accessed on January 12, 2020.

Publication Date: accessed 22 March 2023

Publication Site: Gapminder

What You Can Do To Force Your State Pension To Be Transparent About Its Investments

Link: https://pensionwarriorsdwardsiedle.substack.com/p/what-you-can-do-to-force-your-state

Excerpt:

So what can you do to force your state or local government pension to be more transparent? That’s a question I asked Marc Dann, an attorney in private practice in Ohio and the former Attorney General of Ohio. (Dann is currently litigating a public records request on my behalf against the State Teachers Retirement System of Ohio.)

Say attorney Dann: “Refer to your state’s public records laws in making a request. Be as detailed and specific in the request as you can possibly be. Remember public records are only those records that may actually exist. For example, instead of asking for a list of all hedge, private equity or venture capital fund investments, ask for a prospectus, offering documents or reports provided to the pension by each investment fund (and name the investment funds—which are generally named on the state or local pension’s website).  Most states allow legal fee-shifting in public records lawsuits. So if the pension or fund resists, you may wish to consider bringing in a lawyer who agrees to be paid his fee from any recovery from the pension. Don’t forget to reach out to allied members of your state legislature or city council who can put pressure on the pensions to properly respond to the requests.”

Author(s): Edward Siedle

Publication Date: 22 Mar 2023

Publication Site: Pension Warriors on substack

The Banking Sector Turmoil in Charts

Link: https://www.wsj.com/articles/the-banking-sector-turmoil-in-charts-52bb6095?mod=e2twg

Graphic:

Excerpt:

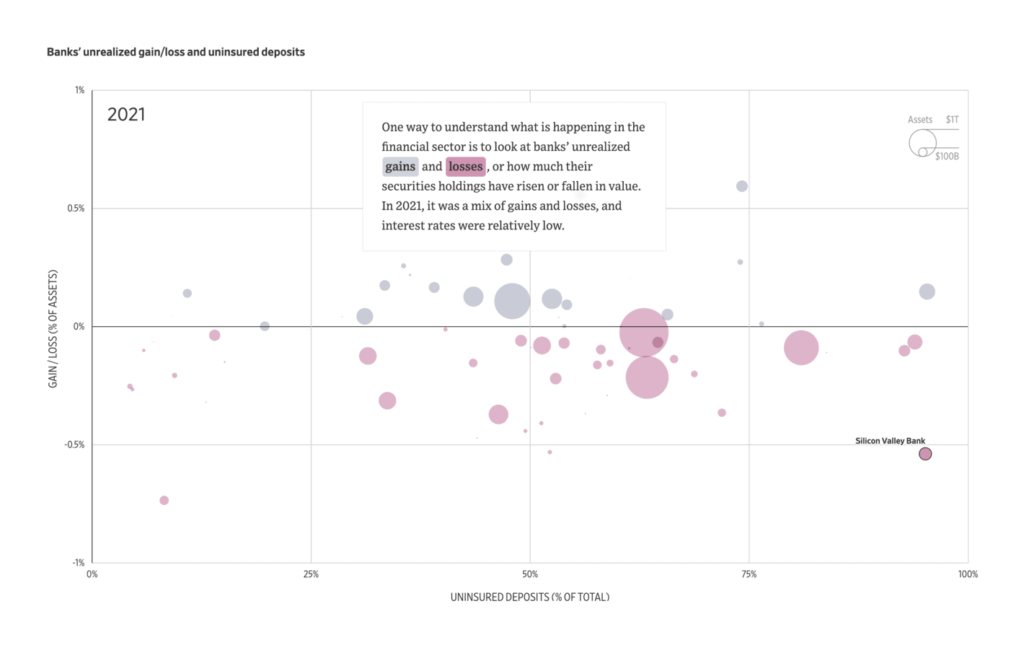
It has been a wild ride for banks. Silicon Valley Bank, which catered to venture capitalists and startups, collapsed March 10 after a run on deposits that was preceded by a plunging share price and a money-losing bond sale as the bank tried to raise capital. Two days later, Signature Bank SBNY -22.87%decrease; red down pointing triangle was closed by federal regulators following a run. Then, First Republic Bank FRC 29.47%increase; green up pointing triangle, at risk of a run as its share price plummeted, was flooded with cash in an extraordinary action by some of the largest U.S. banks—but its shares resumed their plunge a day later. 

Here is how some banks ended up in the market’s crosshairs.

Author(s): Nate Rattner, Alana Pipe

Publication Date: 18 Mar 2023

Publication Site: WSJ

The federal budget outlook

Link: https://www.brookings.edu/research/the-federal-budget-outlook-2/

PDF of report: https://www.brookings.edu/wp-content/uploads/2023/03/20230313_TPC_Gale_FiscalOutlookFINAL.pdf

Graphic:

Excerpt:

The basic story is familiar. Low revenues coupled with rising outlays on health-related programs and Social Security drive permanent, rising primary deficits as a share of the economy. Net interest payments also rise substantially relative to GDP due to high pre-existing debt, rising primary deficits, and gradually increasing interest rates. Unified deficits and public debt rise accordingly.

Under current law for the next 10 years, the CBO’s projections imply that persistent primary deficits will average 3.0% of GDP. Net interest payments will rise from 2.4% of GDP currently to 3.6% in 2033, an all-time high. The unified deficit, and even the cyclically adjusted deficit, will exceed 7% of GDP at the end of decade. Debt will rise from 98% of GDP currently to 118% by 2033, another all-time high.

Over the following two decades, the projected trends are even less auspicious. Primary deficits rise further as spending on Social Security and health-related programs continue to grow faster than GDP and revenue growth remains anemic. The average nominal interest rate on government debt rises to exceed the nominal economic growth rate by 2046, setting off the possibility of explosive debt dynamics.  By 2053, relative to GDP, annual net interest payments exceed 7%, the unified deficit exceeds 11%, and the public debt stands at 195%. All these figures would be all-time highs (except for deficits during World War II and in the first two years of the COVID-19 pandemic) and would continue to grow after 2053.

Author(s): Alan J. Auerbach and William G. Gale

Publication Date: 14 Mar 2023

Publication Site: Brookings