NAIC 2021 Annual/2022 Quarterly Financial Analysis Handbook

Link: https://content.naic.org/sites/default/files/publication-fah-zu-financial-analysis-handbook.pdf

Graphic:

Excerpt:

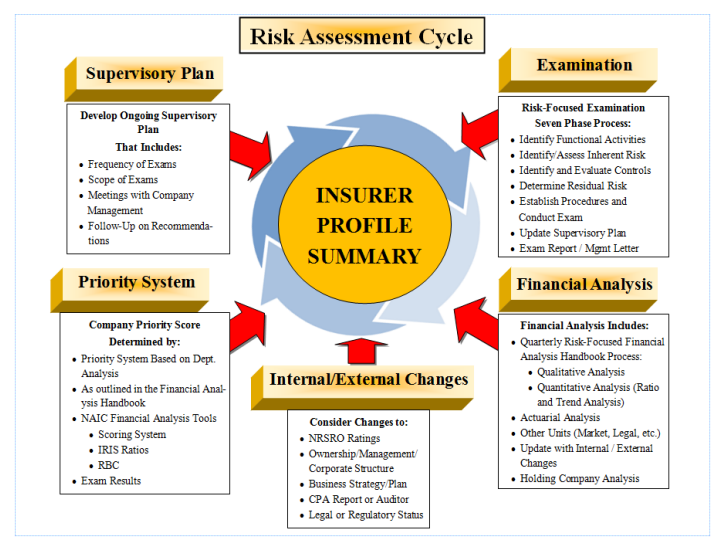
The risk-focused surveillance framework is designed to provide continuous regulatory oversight. The risk-focused approach requires fully coordinated efforts between the financial examination function and the financial analysis function. There should be a continuous exchange of information between the field examination function and the financial analysis function to ensure that all members of the state insurance department are properly informed of solvency issues related to the state’s domestic insurers.

The regulatory Risk-Focused Surveillance Cycle involves five functions, most of which are performed under the current financial solvency oversight role. The enhancements coordinate all of these functions in a more integrated manner that should be consistently applied by state insurance regulators. The five functions of the risk assessment process are illustrated within the Risk-Focused Surveillance Cycle.


As illustrated in the Risk-Focused Surveillance Cycle diagram, elements from the five identified functions
contribute to the development of an IPS. Each state will maintain an IPS for its domestic companies. State
insurance regulators that wish to review an IPS for a non-domestic company will be able to request the IPS from the domestic or lead state. The documentation contained in the IPS is considered proprietary, confidential information that is not intended to be distributed to individuals other than state insurance regulators.

Please note that once the Risk-Focused Surveillance Cycle has begun, any of the inputs to the IPS can be changed at any time to reflect the changing environment of an insurer’s operation and financial condition.

Author(s): NAIC staff

Publication Date: 1 Jan 2022

Publication Site: NAIC

KFF COVID-19 Vaccine Monitor: September 2022

Link: https://www.kff.org/coronavirus-covid-19/poll-finding/kff-covid-19-vaccine-monitor-september-2022/

Graphic:

Excerpt:

Overall adult vaccination rates have been relatively steady over the past year. The latest COVID-19 Vaccine Monitor finds that nearly eight in ten adults (77%) say they have gotten at least one dose of a COVID-19 vaccine, including about half who say they are fully vaccinated and also received at least one booster dose (47%), about a quarter who have been fully vaccinated but have not gotten a booster (26%), and a small share who are partially vaccinated (3%). Twenty-three percent remain unvaccinated, the vast majority of whom say they will “definitely not” get the COVID-19 vaccine (88% of unvaccinated, or 21% of all adults). For the latest breakdown of self-reported vaccination rates by demographic group, see the Vaccine Monitor Dashboard.

In late August, the Food and Drug Administration authorized the use of new, updated COVID-19 vaccine boosters that target both the new omicron variants and the original strain of the virus. The bivalent boosters (one by Moderna and one by Pfizer) are now authorized for use by those ages 12 and older who have gotten an initial series of a COVID-19 vaccine, including those who have already received one or more boosters.

Awareness of the new boosters is modest, with about half of adults saying they have heard “a lot” (17%) or “some” (33%) about updated booster, 31% saying they have heard “a little,” and one in five saying they have heard “nothing at all” about the new booster doses.

Older adults and Democrats are somewhat more likely than their counterparts to say they have heard at least “some” about the new boosters, but fewer than a quarter across these groups report hearing “a lot” about the new shots.

Author(s): Grace Sparks Follow @gracesparks on Twitter , Lunna Lopes , Liz Hamel Follow @lizhamel on Twitter , Alex Montero , Marley Presiado , and Mollyann Brodie Follow @Mollybrodie on Twitter

Publication Date: 30 Sept 2022

Publication Site: Kaiser Family Foundation

Congressional Hearing Considers Private Equity-Controlled Insurers

Link: https://communications.willkie.com/110/1827/uploads-(icalendars-pdf-documents)/congressional-hearing-considers-private-equity-controlled-insurers.pdf

Excerpt:

On September 8, 2022, the U.S. Senate Committee on Banking, Housing and Urban Affairs (“Senate Banking Committee”) held a hearing to consider “Current Issues in Insurance.” One of the items discussed at the hearing was Senator Sherrod Brown’s (D-OH) March 2022 letter to the National Association of Insurance Commissioners (the “NAIC”) and U.S. Department of the Treasury’s Federal Insurance Office (“FIO”) regarding private equity-controlled insurers.1

In his letter, Senator Brown requested that FIO, in consultation with the NAIC, prepare a report for Congress that evaluates the investment strategies pursued by private equity-controlled insurers, the impact on protections for pension plan beneficiaries following pension risk transfer arrangements, and whether state regulatory regimes are capable of assessing and managing risks related to private equity-controlled insurers. In the early summer, the NAIC and the U.S. Department of the Treasury (on behalf of FIO) each provided substantive responses to Senator Brown.2

Author(s): Kara Baysinger | Leah Campbell | Jane Callanan | Matthew J. Gaul
Donald B. Henderson, Jr. | David G. Nadig | Allison J. Tam

Publication Date: 27 Sept 2022

Publication Site: Willkie Farr & Gallagher

Guns Aren’t a Public Health Issue

Link: https://reason.com/video/2022/09/30/guns-arent-a-public-health-issue/

Graphic:

Excerpt:

The takeaway from the story of Dickey, Rosenberg, and the 1993 gun study at the center of the piece is that the congressman was correct to begin with. The CDC shouldn’t be studying gun violence.

Titled “Gun Ownership as a Risk Factor for Homicide in the Home” and published in The New England Journal of Medicine, the 1993 study looked at 388 people who had been killed in their homes and matched them to 388 neighbors of similar age, sex, and race. One hundred and seventy-four of the victims lived in houses where at least one gun was present versus only 139 of the matched controls.

With scary music and breathless claims, the video tells viewers that if you had a gun in your house, you were 200 percent more likely to be killed with a gun in your home and 400 percent more likely to kill yourself. 

These are both exaggerations and misstatements of the study results. It didn’t address suicide risk at all, nor gun homicides. It found households in which a resident had been murdered at home by any means had a 25 percent greater frequency of having a gun, not 200 percent. But this doesn’t mean owning a gun increases your risk of being killed by 25 percent. 

This is a classic statistical error known as the “base rate fallacy” and is particularly important when studying rare events, like people murdered in their homes. Suppose 10 people are murdered in their homes, and five of those homes had guns. A matched set of 10 people who were not murdered in their homes found only four homes had guns. So there are 25 percent more guns in the homes of murder victims than matched nonmurder victims (Five vs. four).

But what if you put those 20 people in the context of another million, none of whom were murdered in their homes, half of whom had guns in their homes and half of whom didn’t. The rate for gun owners to be murdered at home becomes five out of 500,009, while the rate for non-gun owners becomes five out of 500,011. So now we find that the risk is 0.0004 percent higher.

In other words, being murdered in your home means you have a 25 percent higher chance of having a gun, but having a gun means you have only a 0.0004 percent greater chance of being murdered in your home. Those are not the same thing.

The finding that owning a gun made study subjects less safe was also a conclusion selected from much stronger statistical results that didn’t fit the authors’ political views and, thus, weren’t mentioned in the study. Yes, 25 percent more victims’ homes had guns than control homes, but 38 percent more victims had controlled security access to their property. Why not lobby against gates as a public health matter? Twenty times as many victims had gotten in trouble at work because of drinking, so why worry about guns when drinking at work is two orders of magnitude more dangerous? Renting and living alone were far more dangerous than having a gun. Victims were less likely than controls to own a rifle or a shotgun, so why not a government program to trade in handguns for long guns?

Author(s): JOHN OSTERHOUDT AND AARON BROWN

Publication Date: 30 Sept 2022

Publication Site: Reason

5 THINGS WRONG WITH ILLINOIS HOLDING 30% OF U.S. PENSION BOND DEBT

Link: https://www.illinoispolicy.org/5-things-wrong-with-illinois-holding-30-of-u-s-pension-bond-debt/

Graphic:

Excerpt:

Pension obligation bonds, like payday loans, are a sign of mismanaged finances. Illinois not only leads the nation for using that risky debt, it owes the bulk of it.

It is bad Illinois has the nation’s worst pension crisis, but state politicians have made it worse by using risky debt to delay the day of reckoning, and done so to the point that Illinois now owes 30% of the nation’s pension obligation bonds.

….

In 2013, Illinois took a significant step towards addressing the pension crisis by passing Public Act 98-0599. This bill protected any benefits that had already been earned by employees while it amended future benefits. The bill increased the retirement age, replaced 3% compounding annual raises with cost-of-living adjustments tied to inflation and capped maximum pensionable salaries. While not a solution, this bill provided a responsible roadmap addressing the financial issues in the pension system while preserving already earned benefits.

Unfortunately, the bill was declared unconstitutional by the Illinois Supreme Court in 2015 because it was interpreted as changing promised future benefits for pension recipients, even though this could potentially result in financial ruin for Illinois. As a result, a constitutional amendment is needed to allow changes to future pension benefits.

Author(s): Aneesh Bafna

Publication Date: 10 Sept 2021

Publication Site: Illinois Policy Institute

The amazing power of “machine eyes”

Link: https://erictopol.substack.com/p/the-amazing-power-of-machine-eyes

Graphic:

Excerpt:

Today’s report on AI of retinal vessel images to help predict the risk of heart attack and stroke, from over 65,000 UK Biobank participants, reinforces a growing body of evidence that deep neural networks can be trained to “interpret” medical images far beyond what was anticipated. Add that finding to last week’s multinational study of deep learning of retinal photos to detect Alzheimer’s disease with good accuracy. In this post I am going to briefly review what has already been gleaned from 2 classic medical images—the retina and the electrocardiogram (ECG)—as representative for the exciting capability of machine vision to “see” well beyond human limits. Obviously, machines aren’t really seeing or interpreting and don’t have eyes in the human sense, but they sure can be trained from hundreds of thousand (or millions) of images to come up with outputs that are extraordinary. I hope when you’ve read this you’ll agree this is a particularly striking advance, which has not yet been actualized in medical practice, but has enormous potential.

Author(s): Eric Topol

Publication Date: 4 Oct 2022

Publication Site: Eric Topol’s substack, Ground Truths

Where Do People Pay the Most in Property Taxes?

Link: https://taxfoundation.org/property-taxes-by-state-county-2022/

Graphic:

Excerpt:

Median property taxes paid vary widely across (and within) the 50 states. The lowest bills in the country are in six counties or county equivalents with median property taxes of less than $200 a year:

  • Northwest Arctic Borough and the Kusivlak Census Area (Alaska)*
  • Avoyelles, East Carroll, and Madison (Louisiana)
  • Choctaw (Alabama)

(*Significant parts of Alaska have no property taxes, though most of these areas have such small populations that they are excluded from federal surveys.)

The next-lowest median property tax of $201 is found in Allen Parish, near the middle of Louisiana, followed by $218 in McDowell County, West Virginia, in the southernmost part of the state.

The eight counties with the highest median property tax payments all have bills exceeding $10,000:

  • Bergen, Essex, and Union (New Jersey)
  • Nassau, New York, Rockland, and Westchester (New York)
  • Falls Church (Virginia)

All but Falls Church are near New York City, as is the next highest, Passaic County, New Jersey ($9,999). 

Author(s): Janelle Fritts

Publication Date: 13 Sept 2022

Publication Site: Tax Foundation

Actuarial Modernization Errors

Link: https://www.theactuarymagazine.org/actuarial-modernization-errors/

Excerpt:

Professionalization leads us to an interesting dilemma. Actuarial culture and, for that matter, organizational culture got insurance companies to where they are today. If the culture were not moderately successful, then the company would not still exist. But this is where Prospect theory emerges from the shadows. It is human nature not to want to lose the culture that enabled your success. Many people nonetheless thirst for the gains earned by moving in a new direction. Risk aversion further reinforces the stickiness of culture, especially for risk-averse professions and industries. Drawing from author Tony Robbins, you cannot become who you want to be by staying who you currently are. Our professionalization, coupled with our risk aversion, creates a double whammy. Practices appropriate to prior eras have a propensity to be locked in place. Oh, but it gets worse!

By the nature of transformation and modernization, knowledge and know-how are embedded in the current people, processes and systems. The knowledge and know-how must be migrated from the prior technology to modern technology. Just like your computer’s hard drive gets fragmented, so too do firms’ expertise as people change focus, move jobs or leave companies. The long-dated nature of our promises can severely exacerbate the issue. Human knowledge and know-how are not very compressible, unlike biological seeds and eggs. In a time-consuming defragmenting exercise, information, knowledge and know-how must be painstakingly moved, relearned and adapted for the new system. This transformation requires new practices, further exacerbating the shock to the culture. Oh, but it gets even worse!

The transformation process requires existing teams to change, recombine or communicate in new ways. This means their cultures will potentially clash. Lack of trust and bureaucracy are the most significant frictions to collaboration among networks. The direct evidence of this is when project managers vent that teams x, y and z cannot seem to work together. It is because they do not have a reference system to know how to work together.

Author(s): Bryon Robidoux

Publication Date: September 2022

Publication Site: The Actuary

Debt Forgiveness Won’t Shield Students from Illinois’ Pension Pinch

Link: https://www.realclearpolicy.com/articles/2022/09/14/debt_forgiveness_wont_shield_students_from_illinois_pension_pinch_853360.html

Excerpt:

Families in Illinois are now burdened with the fourth most expensive in-state tuition prices in the nation, and the highest in the Midwest. 

Take U of I’s flagship Urbana-Champaign campus, with base tuition and fees now starting at $17,138 a year. In comparison, a Big-10 education for in-state students attending Indiana University-Bloomington or the University of Wisconsin-Madison costs nearly $6,000 less.

Illinois schools cost more because most other states don’t have Illinois-sized pension debt – most recently estimated at $140 billion by the Commission on Government Forecasting and Accountability. 

Illinois Policy Institute research shows state funding has declined for higher education operations by 26%  in real terms from fiscal year 2007 through fiscal year 2022, while spending on university pensions has exploded by 514%.

Another way of looking at it is the State Universities Retirement System pension payments accounted for 9% of the state’s higher education spending in 2007. Today, they account for 44% of total higher education dollars. That translates to $776 million less for colleges and universities to allocate toward services that directly benefit students in 2022.

Author(s): Amy Korte

Publication Date: 14 Sept 2022

Publication Site: Real Clear Policy

Massachusetts’ Graduated Income Tax Amendment Threatens the Commonwealth’s Economic Transformation

Link: https://taxfoundation.org/massachusetts-graduated-income-tax-amendment/

Graphic:

Excerpt:

Massachusetts is already trending in the wrong direction in terms of migration. Since 2013, Massachusetts’ net population change levels have been trending downward; and in 2020 the Commonwealth realized its first net negative population change since 2004. Massachusetts lost an estimated 1,309 residents in 2020 but that figure grew to 37,497 by 2021. Much of that change is likely attributable to various changes brought on by the pandemic, including the expansion of remote work opportunities. However, Massachusetts’ struggle with migration precedes the pandemic.

The Bay State’s net migration levels generally mirror the downward trajectory of the net population change figures, but a closer look reveals that Massachusetts was experiencing net negative migration even before the pandemic began. The downward trend for net migration reached net negative levels in 2019, the first year since 2007.

Whether Massachusetts’ net migration figure is positive or negative primarily depends on the strength of net international migration. For 20 of the last 22 years, Massachusetts has seen net negative domestic migration. What this effectively means is that it is preferable to migrate to Massachusetts from abroad, but once a person lives there, it is preferable to move somewhere else. Between July 1, 2020 and July 1, 2021, an estimated 12,675 more people moved to the Bay State from abroad than left for foreign destinations. However, 46,187 more people left Massachusetts for other domestic locations than moved in from elsewhere in the United States.[14] This should concern policymakers, but the figure that should be even more concerning is the net outmigration of adjusted gross income (AGI).

Author(s): Timothy Vermeer

Publication Date: 13 Sept 2022

Publication Site: Tax Foundation

Public Coverage Increased for All Workers, Private Coverage Declined for Full-Time, Year-Round Workers

Link: https://www.census.gov/library/stories/2022/09/private-health-coverage-declines-for-full-time-workers.html

Graphic:

Excerpt:

Between 2020 and 2021, there were changes in health insurance coverage rates for both full-time, year-round workers and those who worked less than full time, year-round. 

The uninsured rate for full-time, year-round workers was 0.6 percentage points higher in 2021 than in 2020. Compared to 2020, a larger share of these workers had public coverage and a smaller share had private coverage, such as employer-based coverage.

Those who worked less than full time, year-round were 1.2 percentage points less likely to be uninsured in 2021 — not because more had private coverage but because a larger share had public health insurance.  

Author(s): Katherine Keisler-Starkey, Laryssa Mykyta and Lisa Bunch

Publication Date: 13 Sept 2022

Publication Site: Census Bureau