The consumer price index data for August, released Tuesday, shows 8.3% inflation over the past 12 months before a seasonal adjustment and was 0.1% from July to August on a seasonally adjusted basis. In July, prices rose by 8.5% over 12 months and were unchanged from June.
Based on the new data through August, The Senior Citizens League estimates the Social Security cost-of-living adjustment, or COLA, for 2023 could be 8.7%, lower than the 9.6% it predicted last month.
An 8.7% COLA would be the biggest increase since 1981. The adjustment would increase the average retiree benefit of $1,656 by $144.10, according to the league.
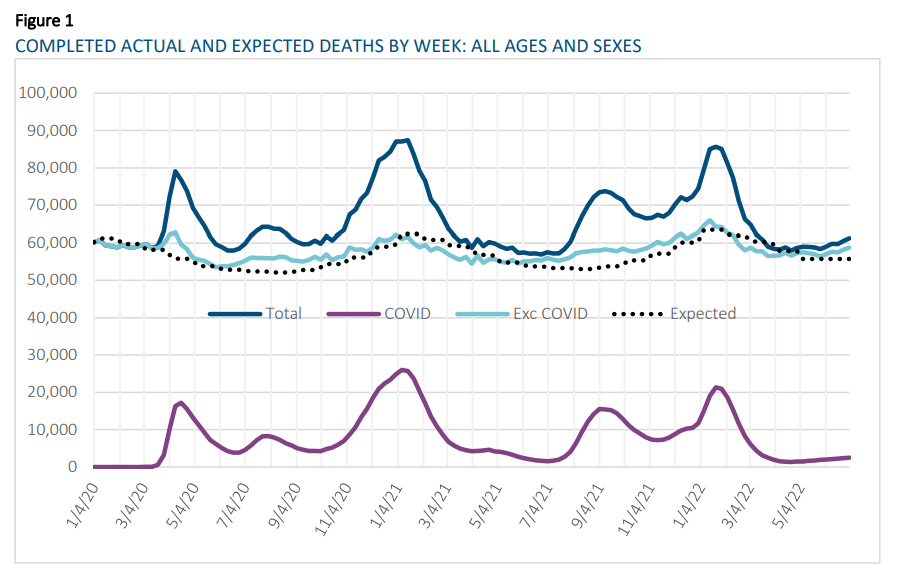
The data used for this analysis was provided by the CDC as of August 17, 2022 and includes incurred deaths by week, beginning on December 29, 2019 and going through July 2, 2022. For 2020, the CDC defines Week 1 as ranging from December 29, 2019 through January 4, 2020 and Week 52 as ranging from December 19, 2020 through December 26, 2020, so when reporting on 2020 results, this convention is used. The year 2021 begins on December 27, 2020 and runs through January 2, 2022. For the purposes of this analysis, the start of the COVID-19 active period is March 22, 2020. Due to the delay in reporting, the actual deaths have been completed based on factors that vary by age and sex. These are shown below along with the expectations that are based on the five-year trend after adjusting for seasonality.
These data are as of August 17, 2022 and exclude deaths that occurred after July 2, 2022. Figure 1 shows that, for most months, the total A/E ratio is much greater than 100%, while the A/E ratio excluding COVID19 deaths is also greater than 100% by a few percent.
Author(s): Rick Leavitt, ASA, MAAA
Publication Date: August 2022
Publication Site: Society of Actuaries Research Institute
Early government mortality numbers show that the number of U.S. deaths has stayed very high this summer, both for members of the general population and for working-age people.
For all U.S. residents, for the period from July 3 through Aug. 27, the number of deaths recorded in the U.S. Centers for Disease Control and Prevention’s FluView reports was 426,881, according to the report released Friday, which included data sent to the CDC by Sept. 3.
The “all cause” total for the general population was down just 0.8% from the total for the comparable period in 2021, and it was 22% higher than the total for the comparable period in 2019, before the COVID-19 pandemic began.
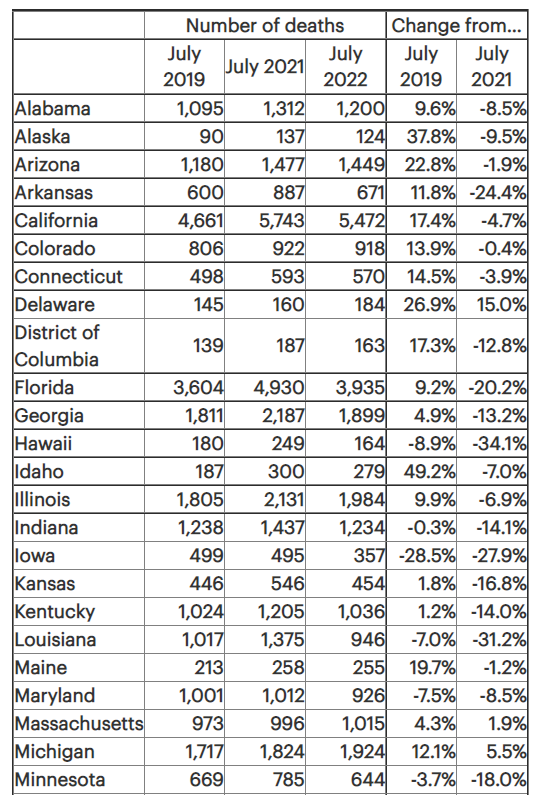
For U.S. residents ages 25 through 64, the all-cause death total during that same period was 113,665, according to early, weighted data in the CDC’s Weekly Counts of Deaths by Jurisdiction and Age reports, as of Sept. 8.
If you followed the saga of the route to passage of the Inflation Reduction Act, you already know that a last-minute maneuver by Arizona Sen. Kyrsten Sinema torpedoed a provision in the Senate compromise bill that would have finally closed the so-called “carried interest loophole.” That’s where savvy real-estate financiers and managers of private partnerships such as hedge funds and private equity deals are able to cut their income taxes as much as 40 percent by masquerading their compensation as a capital gain that enjoys much lower income tax rates.
….
Public pension funds, public employees and their associations need to put a stop to this, and they have both the moral high ground and the clout to do so. It’s high time for political and financial blowback. The PR firms orchestrating this nonsense will just keep it up until their profiteering clients get called out.
….
The reality is that if the fund managers had to pay standard tax rates on their income, it would have zero impact on pension systems’ returns. What are the managers going to do? Cook up fewer deals? Pull up stakes and move to a tax haven? Demand even higher fees on top of their already cushy income? They can huff and puff all they want, but pensioners would lose nothing if the loophole were plugged.
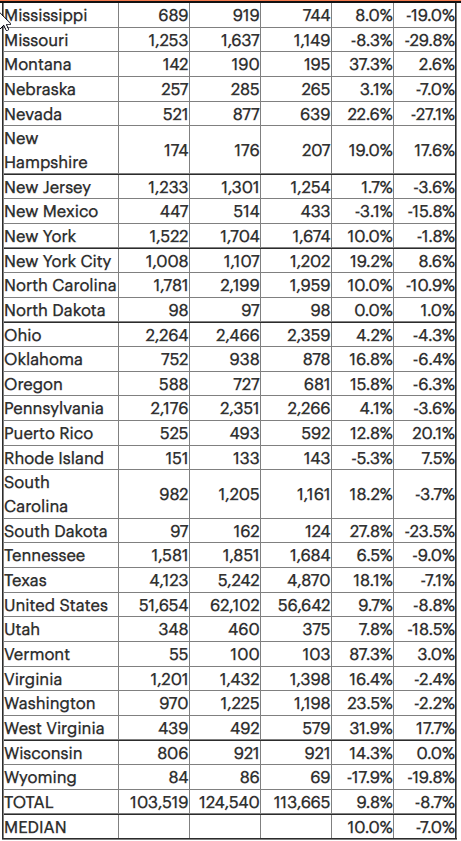
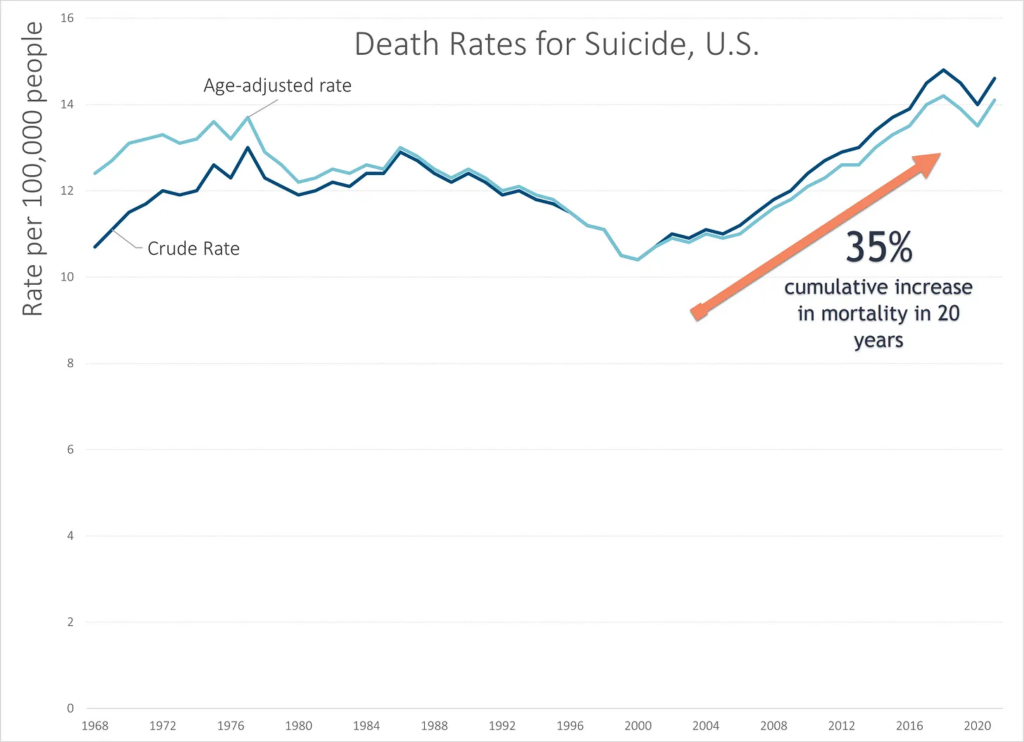
In updating the 2021 numbers, there is some bad news: while suicide rates had decreased in 2020, in 2021 they increased to continue a worrying trend:
The increase in 2021 brought the age-adjusted death rate back to a level close to the peak, which was in 2018.
As noted on the graph, the cumulative increase in the age-adjusted death rate from the minimum in 2000 to the current levels has been 35%. This is very worrying.
I could have exaggerated this trend by starting my vertical scale at 10 instead of 0, but I think it’s obvious enough the trend is bad.
Gen Re is pleased to share the results from our latest U.S. Group Term Life Market Survey, an industry benchmarking survey covering the Group Term Life (GTL) and AD&D industry. The survey tracks sales and in‑force results as well as lapse rate and employee-paid data.
Twenty-one of the 29 companies participating in the 2021 survey have provided Group Term Life data over the past 10 survey years.
Twenty-nine companies provided GTL results for 2021. Twenty-seven provided AD&D results. On a combined basis, total GTL and AD&D in‑force premium reached $31.6 billion, with GTL representing the majority (94%) of the total. (Exhibit A)
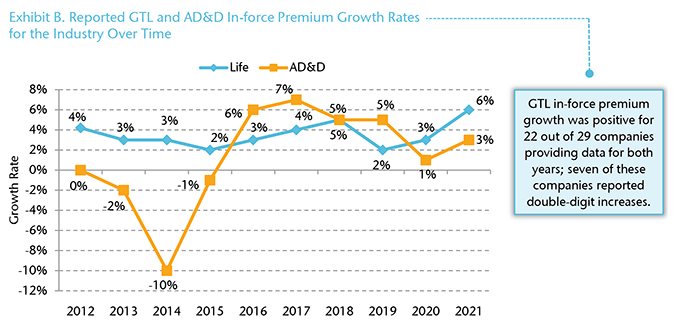
For GTL in‑force premium, reported industry growth has ranged between 2% and 5% over the past 10 years. In 2021, in‑force premium grew by 6% compared to 2020.
After a five-year low of 1% growth in 2020, AD&D in‑force premium rose by 3% in 2021. (Exhibit B)
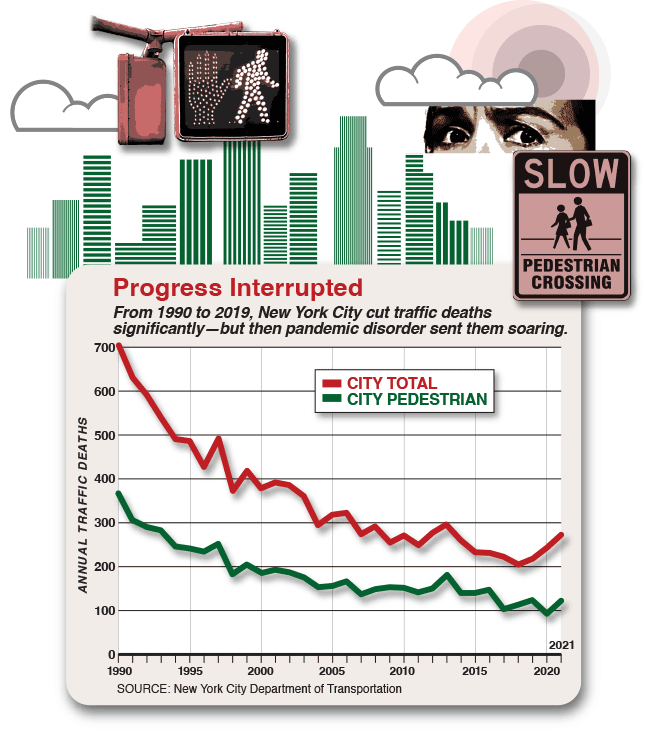
Since the Covid pandemic hit New York City in March 2020, traffic deaths have skyrocketed, just as they have across the country. Locally and nationally, these deaths have paralleled the same double-digit trajectory upward as homicides and drug-overdose deaths. In 2019, 220 New Yorkers died on city streets, near the record low of 206, set the year before. In 2021, 273 people died, a nearly one-quarter increase in two years. In 2022, as of late May, 93 people have died, down slightly from last year, but 12 percent above pre-Covid levels.
….
s in many areas of public safety and public health, New York City started the pandemic with an advantage. In 2019, the city’s 220 traffic deaths—whether people in cars, or pedestrians, or cyclists—represented a per-capita rate of about 2.6 per 100,000 residents, just a small fraction of the 11.1 per 100,000 killed nationwide. Among large, urbanized areas, New York stood out for safety, as well. In Miami-Dade County in 2019, for example, the rate was 11 per 100,000; metro Atlanta’s rate was similar. Even among denser northeastern and mid-Atlantic cities, which have long had lower traffic-death rates than the sprawling south and west, New York performed slightly better than Boston, with its 2.8 traffic deaths per 100,000, and much better than Philadelphia, with its 5.7 deaths per 100,000.
Pre-pandemic, New York’s falling traffic deaths made it a national outlier. Between 2011, when traffic deaths hit a modern low nationwide, and 2019, such fatalities across the country rose by 11.9 percent, to 36,355 annually. In Gotham over this period, by contrast, they fell 12 percent. The difference in pedestrian casualties was especially striking. Nationwide, pedestrian deaths began rising in 2010, after having fallen, reasonably steadily, for at least three decades. By 2019, annual pedestrian deaths had risen from their 2009 low by more than half. But in New York, pedestrian deaths fell by 21.5 percent over the same near-decade.
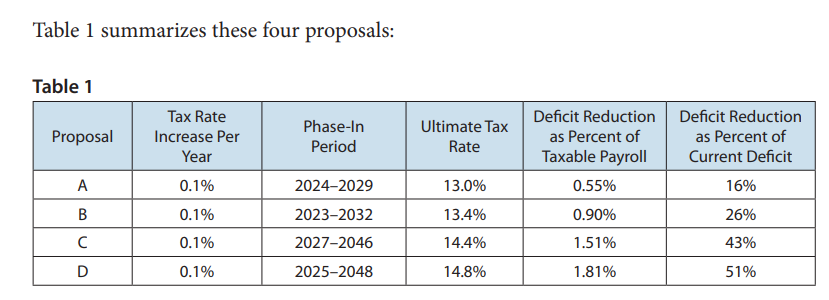
Social Security was originally funded by a tax on the wages of covered workers plus interest on accumulated taxes not yet paid out as benefits. Later, a tax on the benefits of some beneficiaries was added. • Both the tax rate and the limit on wages subject to taxation have been raised periodically to fund increases in the scope and amount of benefits. • According to the 2021 Social Security Trustees Report, accumulated assets will be depleted by 2034 and income to the system thereafter will be insufficient to pay all scheduled benefits when due. • Some or all of this shortfall can be averted by raising the tax rate on wages, increasing the limit on wages subject to taxation, broadening coverage to include all state and local government employees, increasing taxes on benefits, and/or creating new taxes dedicated to funding Social Security benefits. • This issue brief explores a wide variety of proposals for increasing system revenue that have been made over the years by members of Congress, government-appointed panels and commissions, and outside experts.
Author(s): American Academy of Actuaries Social Security Committee
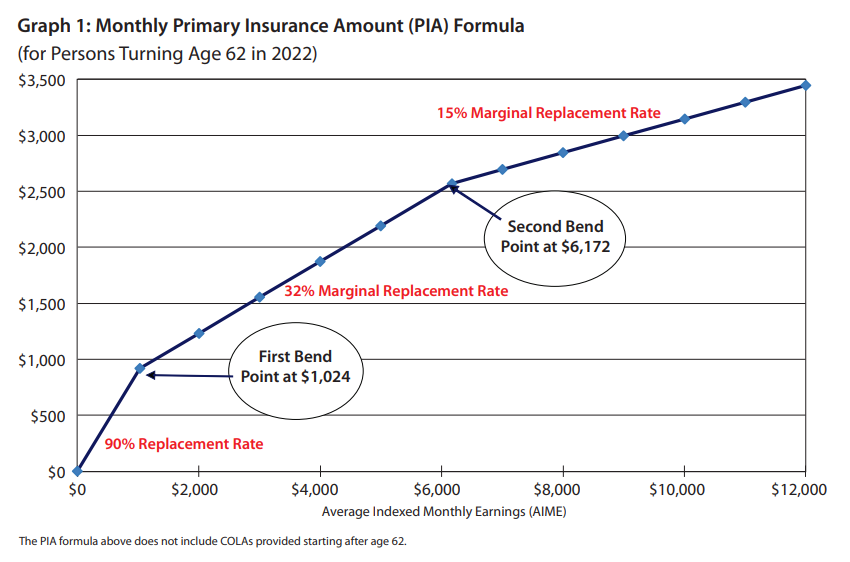
From its inception, the formulas for determining benefits payable under the Social Security System have included elements of individual equity and social adequacy, so that benefits vary in proportion to differences in worker contributions, yet benefits are sufficient to meet the deemed financial needs of most workers and covered dependents. • According to the 2021 Social Security Trustees Report, accumulated assets will be depleted by 2034 and income to the system thereafter will be insufficient to pay all scheduled benefits when due. • Some or all of this shortfall can be averted by changing the primary formula for retired worker benefits, changing the formulas for determining the benefits of eligible spouses and other dependents of workers, and/or changing the formula for computing annual cost-of-living increases. • This issue brief explores a wide variety of proposals for changing the formulas for determining benefits that have been made over the years by members of Congress, government-appointed panels and commissions, and outside experts, with an eye toward how the proposed changes would affect the balance between individual equity and social adequacy.
Author(s): American Academy of Actuaries Social Security Committee
New York State Comptroller Thomas P. DiNapoli today announced employer contribution rates for the New York State and Local Retirement System (NYSLRS). Employers’ average contribution rates for the State Fiscal Year 2023-24 will increase from 11.6% to 13.1% of payroll for the Employees’ Retirement System (ERS) and from 27.0% to 27.8% of payroll for the Police and Fire Retirement System (PFRS).
NYSLRS is made up of these two systems, which pay retirement and disability benefits to public employees and death benefits to their survivors.
“The state pension fund’s performance in the fiscal year that ended March 31 was strong, but recent domestic and global economic volatility demands caution,” DiNapoli said. “As we move forward with our prudent investment strategy, we remain focused on long-term stable returns for New York’s public employers and workforce. Uncertainty may be a constant in financial markets, but the rates announced today will help ensure that New York’s pension fund will continue to be one of the nation’s strongest and best funded, ready to provide retirement security for generations to come.”
Author(s): press release of Office of State Comptroller of New York