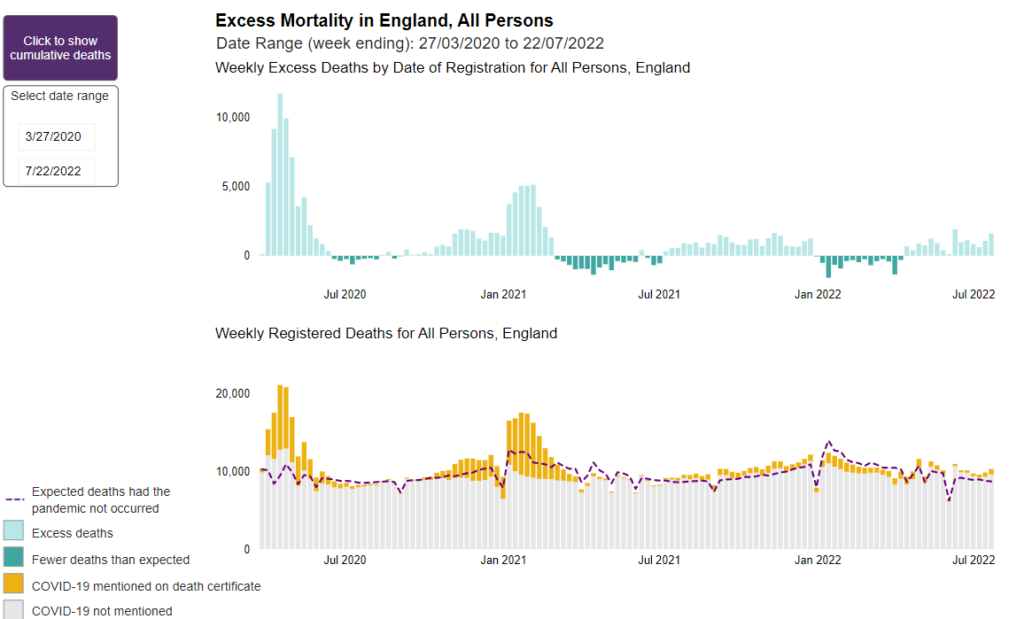
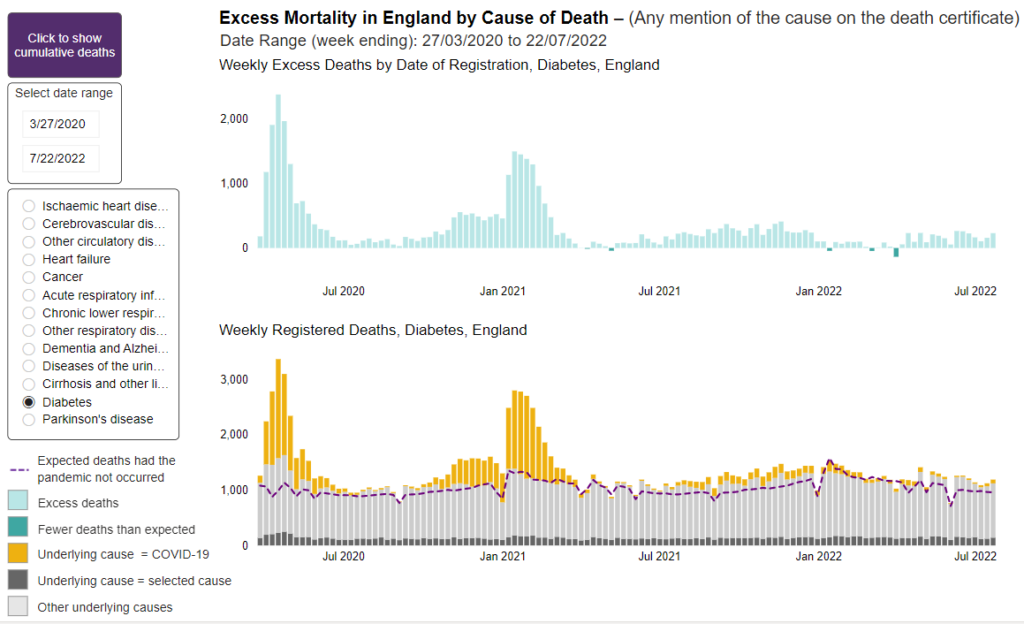
The Teacher Retirement System of Texas needs to adjust its investment return assumptions

Link: https://reason.org/commentary/the-teacher-retirement-system-of-texas-needs-to-adjust-its-investment-return-assumptions/

Graphic:

Excerpt:

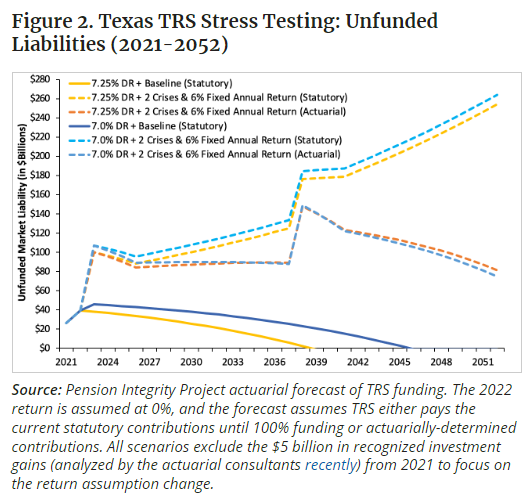
An adjustment of the assumed rate of return down to 7.0% means the plan will recalculate pension debt upwards in 2023, but will also be better positioned to avoid future debt growth over the longer run. The forecast in Figure 2 compares the growth of TRS’ unfunded liabilities under three scenarios: 

  1. Returns meet TRS assumptions;
  2. TRS experiences two major recessions over the next 30 years;
  3. And, TRS makes actuarially determined contributions (also using the two-recession scenario).

With this actuarial modeling of the system, it is clear that statutorily limited contributions will continue to pose funding risks for TRS that will be borne by Texas taxpayers. A proposed 7.0% assumed return will readjust 2023 unfunded liabilities upwards by $6.5 billion, but the plan will suffer fewer investment losses over the next 30 years when the plan inevitably experiences returns that diverge from expectations. TRS’ unfunded liabilities will remain elevated under the rigid statutorily-set contributions. If, however, TRS was to transition to Actuarially Determined Employer Contributions (ADEC) each year, then even by recognizing higher 2023 debt (under a 7.0% assumption) TRS could shave billions off its unfunded liabilities by 2052 ($74.7 billion down from $81.3 billion with current 7.25% assumption).  

Author(s): Anil Niraula, Zachary Christensen

Publication Date: 15 Jun 2022

Publication Site: Reason

Excess mortality in England

Link: https://app.powerbi.com/view?r=eyJrIjoiYmUwNmFhMjYtNGZhYS00NDk2LWFlMTAtOTg0OGNhNmFiNGM0IiwidCI6ImVlNGUxNDk5LTRhMzUtNGIyZS1hZDQ3LTVmM2NmOWRlODY2NiIsImMiOjh9

Data download:

Graphic:

Excerpt:

The numbers of expected deaths are estimated using statistical models and based on previous 5 years’ (2015 to 2019) mortality rates. Weekly monitoring of excess mortality from all causes throughout the COVID-19 pandemic provides an objective and comparable measure of the scale of the pandemic [reference 1]. Measuring excess mortality from all causes, instead of focusing solely on mortality from COVID-19, overcomes the issues of variation in testing and differential coding of cause of death between individuals and over time [reference 1].


In the weekly reports, estimates of excess deaths are presented by week of registration at national and subnational level, for subgroups of the population (age groups, sex, deprivation groups, ethnic groups) and by cause of death and place of death.

Author(s): Office for Health Improvement and Disparities

Publication Date: accessed 10 Aug 2022

Publication Site: Public PowerBI dashboard

Book Review: A Global History of the Black Death

Link: https://undark.org/2022/07/29/book-review-a-global-history-of-the-black-death/

Excerpt:

James Belich’s new book, “The World the Plague Made: The Black Death and the Rise of Europe,” shows the depth and longevity of the controversy over the sources and impacts of an era-defining scourge. Belich, an Oxford University historian, suggests that what is now known as the Black Death was so consequential that its effects equal those of the Enlightenment, the Reformation, the Industrial Revolution, and the Renaissance. It’s a staggering implication, but he makes a decent case for it in this bold, tremendously researched work. From illustrating the plague’s effects globally to showing how central it was to Europe’s ascension, Belich demonstrates that the medieval pandemic influenced many aspects of human life.

Once called the Great Death or the Great Plague, the pandemic lasted hundreds of years and was so deadly that it is still popularly referred to simply as the Plague. “The Black Death Pandemic, beginning in 1345, persisted for more than three centuries and involved about 30 major epidemics in all,” writes Belich. What’s more, it “did not always behave like the modern pandemic,” he writes further on. “It killed far more people, for one thing.” Belich’s book implicitly underscores that, compared to the devastation of the plague, Covid-19 is relatively insignificant.

Just how many deaths was the Black Death responsible for? Despite centuries of debate on the subject, there is no consensus. The common belief is that the first wave killed between 25 percent and 33 percent of Western Europeans. (The historian Barbara Tuchman advanced the one-third estimate in her best-selling 1978 book about the 14th century, “A Distant Mirror.”) Belich suggests that the number was far higher. In the first strike alone, the population of Western Europe was cut in half, he writes, citing studies about the death rates in England, France, Italy, and Scandinavia. Many places didn’t return to their pre-plague population levels for some 250 years. (Despite his claims, the true extent of the toll is still widely contested.)

….

In Belich’s view, what made the plague different from other major historical events and catastrophes was that, while it decimated the human population, it left the material world untouched. It “doubled the average amount per person of everything,” from horses to housing, he writes. For a time, this meant more resources for survivors and greater access to luxury goods, better living conditions, and higher wages for workers.

Author(s): Jordan Michael Smith

Publication Date: 29 July 2022

Publication Site: unDark

Justice Department Ends Investigation of Pennsylvania PSERS

Link: https://www.ai-cio.com/news/justice-department-ends-investigation-of-pennsylvania-psers/

Excerpt:

The Department of Justice has dropped its investigation into the Pennsylvania Public School Employees’ Retirement System, said Chris Santa Maria, chairman of the $75.9 billion pension fund’s board of trustees, in a statement. PSERS made no further comment on the matter.

The pension fund had been under investigation by the Justice Department since at least May of last year, when subpoenas indicated that the FBI and prosecutors were seeking evidence of kickbacks and bribes at PSERS.

The subpoenas were reportedly looking for information from the pension fund, its executive director, chief financial officer, chief auditing officer and deputy CIO. The court orders reportedly showed that the FBI and prosecutors were probing possible “honest services fraud” and wire fraud.

….

According to a report released earlier this year following an internal investigation, PSERS investment consultant Aon took responsibility for the accounting error. The report includes a letter from Aon to Grossman that said the firm had become aware of data corruption in some sub-composite market values, cashflows and returns for April 2015.

Aon attributed the data corruption to an error by an analyst in uploading net asset value and cashflow data into the performance system it uses. The company said the data corruption impacted “a few asset class composites” in the public markets.

Author(s): Michael Katz

Publication Date: 3 Aug 2022

Publication Site: ai-CIO

What is the State of Pensions in 2022?

Link: https://www.truthinaccounting.org/news/detail/what-is-the-state-of-pensions-in-2022

Excerpt:

State retirement systems in America are still Fragile. 

….

Despite state and local plans reporting disappointing preliminary investment returns averaging -10.4% in 2022 , there has been a net positive funded ratio trend on net over the past three years. 

Funded status in 2022 for state and local retirement systems has declined considerably from last year, the sharpest single-year decline since the Great Recession and financial crisis. Investment return volatility is contributing to some significant swings in funded levels, which has been compounded by rising inflation and geopolitical turmoil. 

Author(s): Anthony Randazzo, Jonathan Moody

Publication Date: 26 July 2022

Publication Site: Truth in Accounting

Sources of Fluctuations in Short-Term Yields and Recession Probabilities

Link: https://www.chicagofed.org/publications/chicago-fed-letter/2022/469

Graphic:

Excerpt:

We simulate future realizations of the policy gap and the slope of inflation forecasts from the 2022:Q2 initial conditions through 2023:Q4 using the ABC model. We then evaluate the recession probability predicted by our preferred probit model for each of these simulated paths. Through this analysis, we show that future inflation outcomes and the odds of a recession depend critically on both the pace of removal of monetary policy accommodation and on how restrictive the monetary policy stance will become over the medium term. In particular, we highlight two scenarios: The first one, which we refer to as the “baseline case,” reflects the ABC model forecasts or, equivalently, the average of all simulated paths. The second one, which we label the “tighter-policy scenario,” is characterized by a faster removal of monetary policy accommodation; it is identified by the average of the simulated paths in which policy becomes restrictive by the end of 2022.11

1. Baseline case: As of early June 2022, the ABC model predicts that nominal and real yields will rise over the next six quarters, the current policy gap will narrow and become mildly restrictive in mid-2023, while core inflation will fall and remain around one percentage point above its model-implied longer-run expectations through 2023 (figure 2, blue lines in panels A and B). The expected tightening of the policy gap and a downward-sloping expected inflation path combine to increase the one-year-ahead recession probability to about 35% by 2023 (figure 2, blue line panel C). Such a level is comparable to the one estimated ahead of the 1994 monetary policy tightening cycle that was followed by a soft-landing scenario.

2. Tighter-policy scenario: In this alternative scenario, monetary policy becomes more restrictive than in the baseline case, in that the policy gap is markedly restrictive over 2023. In this case we find that core inflation declines more rapidly than under the baseline, closing the gap with its model-implied longer-run expectations almost completely by the end of 2023. By that date, in this scenario the likelihood of a recession approaches 60%, a level that, based on our historical estimates, is generally followed by a recession in our sample (figure 2, red lines).

Author(s): Andrea Ajello , Luca Benzoni , Makena Schwinn , Yannick Timmer , Francisco Vazquez-Grande

Publication Date: August 2022

Publication Site: Federal Reserve Bank of Chicago

Individual Disability Carriers Steer Through Uncertain Times

Link: https://www.genre.com/knowledge/blog/2022/august/individual-disability-carriers-steer-through-uncertain-times-en

Graphic:

Excerpt:

Seventeen carriers participated in our 2021 U.S. Individual Disability Market Survey, representing 99% of the market and $5.1 billion of in‑force premium. New sales in 2021 were $399 million which was flat when compared to new sales in 2020. Breaking this down even further, both Non-Cancelable (Non‑Can) and Guaranteed Renewable (GR) sales were flat when compared to 2020. Non‑Can was down 0.1% and GR was up 0.5%. Of the $399 million in total new sales premium, Non‑Can products represent 84% or $334 million, and GR is 16% or $65 million.

When asked about meeting their 2021 sales goals, 47% of the responding companies said they missed theirs. 18% of the companies met and 35% of the companies exceeded their goals. Some of the reasons given for missing sales goals were:

COVID limited face-to-face contact with consumers

Agents were focused on other products such as life insurance

The number of new policies issued grew by 2% to over 251,000 and total benefit amounts increased by 3% to more than $1.6 billion. The medical market continues to be a main driver of new business. In 2021, close to 30% of all new policies sold were in the medical market; however, the industry did see some growth down-market with increases in the number of new policies sold in the blue collar space.

Author(s): Steve Woods

Publication Date: 3 Aug 2022

Publication Site: Gen Re Perspective

Business Cycle Dating Procedure: Frequently Asked Questions

Link: https://www.nber.org/business-cycle-dating-procedure-frequently-asked-questions

Excerpt:

Q: The financial press often states the definition of a recession as two consecutive quarters of decline in real GDP. How does that relate to the NBER’s recession dates?

A: Most of the recessions identified by our procedures do consist of two or more consecutive quarters of declining real GDP, but not all of them. In 2001, for example, the recession did not include two consecutive quarters of decline in real GDP. In the recession from the peak in December 2007 to the trough in June 2009, real GDP declined in the first, third, and fourth quarters of 2008 and in the first and second quarters of 2009. Real GDI declined for the final three quarters of 2001 and for five of the six quarters in the 2007–2009 recession.

Q: Why doesn’t the committee accept the two-quarter definition?

A: There are several reasons. First, we do not identify economic activity solely with real GDP, but consider a range of indicators. Second, we consider the depth of the decline in economic activity. The NBER definition includes the phrase, “a significant decline in economic activity.” Thus real GDP could decline by relatively small amounts in two consecutive quarters without warranting the determination that a peak had occurred. Third, our main focus is on the monthly chronology, which requires consideration of monthly indicators. Fourth, in examining the behavior of production on a quarterly basis, where real GDP data are available, we give equal weight to real GDI. The difference between GDP and GDI—called the “statistical discrepancy”—was particularly important in the recessions of 2001 and 2007–2009.

Author(s):

Publication Date: 19 July 2021 last updated, accessed 3 August 2022

Publication Site: NBER

Examining the Teachers Retirement System of Texas after the pension reforms of 2019

Link: https://reason.org/backgrounder/reason-review-trs-after-sb12/

Graphic:

Excerpt:

TRS currently uses a 7.25% assumed rate of return, which is on the higher end of investment return assumptions among major public systems.

The national average expected rate of return has fallen to 7.0% over the years, with major plans like CalPERS now lowering assumptions into the 6-7% range.

Despite SB12 (2019), with investment returns expected to underperform over the next decade relative to expectations, capping contribution rates in statute creates the perfect conditions for unfunded liabilities to keep accruing just as they have since 2001.

Author(s): Leonard Gilroy, Steven Gassenberger

Publication Date: 3 June 2022

Publication Site: Reason

What can go wrong? Exploring racial equity dataviz and deficit thinking, with Pieta Blakely.

Link: https://3iap.com/what-can-go-wrong-racial-equity-data-visualization-deficit-thinking-VV8acXLQQnWvvg4NLP9LTA/

Graphic:

Excerpt:

For anti-racist dataviz, our most effective tool is context. The way that data is framed can make a very real impact on how it’s interpreted. For example, this case study from the New York Times shows two different framings of the same economic data and how, depending on where the author starts the X-Axis, it can tell 2 very different — but both accurate — stories about the subject.

As Pieta previously highlighted, dataviz in spaces that address race / ethnicity are sensitive to “deficit framing.” That is, when it’s presented in a way that over-emphasizes differences between groups (while hiding the diversity of outcomes within groups), it promotes deficit thinking (see below) and can reinforce stereotypes about the (often minoritized) groups in focus.

In a follow up study, Eli and Cindy Xiong (of UMass’ HCI-VIS Lab) confirmed Pieta’s arguments, showing that even “neutral” data visualizations of outcome disparities can lead to deficit thinking (and therefore stereotyping) and that the way visualizations are designed can significantly impact these harmful tendencies.

Author(s): Eli Holder, Pieta Blakely

Publication Date: 2 Aug 2022

Publication Site: 3iap

Report: CT’s pension debt remains high despite residents’ personal wealth

Link: https://ctmirror.org/2022/08/02/report-ct-pension-debt-personal-income-high-eighth-worst-us/

Graphic:

Excerpt:

When Connecticut deposits roughly $4.1 billion into its pension funds this fall, it will mark the third consecutive year the state used its budget surplus to whittle down the massive pension debt accrued over more than seven decades.

But a recent analysis from The Pew Charitable Trusts provided a sobering reminder of just how far Connecticut still has to go — even considering its great wealth — to overcome decades of fiscal irresponsibility.

Connecticut had reported more than $41 billion in combined debt among its pensions for state employees and for teachers following the 2019 fiscal year. According to Pew, that represented 14.8% of Connecticut’s personal income at the time — more than double the national average of 6.8%.

Connecticut was one of just 10 states that topped the 10% mark, and ranked eighth-worst overall. New Jersey finished at the bottom with pension debt equal to 20.2% of statewide personal income.

Author(s): Keith Phaneuf

Publication Date: 2 Aug 2022

Publication Site: CT Mirror

“Dispersion & Disparity” Research Project Results

Link: https://3iap.com/dispersion-disparity-equity-centered-data-visualization-research-project-Wi-58RCVQNSz6ypjoIoqOQ/

Graphic:

The same dataset, visualized two different ways. The left fixates on between-group differences, which can encourage stereotyping. The right shows both between and within group differences, which may discourage viewers’ tendencies to stereotype the groups being visualized.

Excerpt:

Ignoring or deemphasizing uncertainty in dataviz can create false impressions of group homogeneity (low outcome variance). If stereotypes stem from false impressions of group homogeneity, then the way visualizations represent uncertainty (or choose to ignore it) could exacerbate these false impressions of homogeneity and mislead viewers toward stereotyping.

If this is the case, then social-outcome-disparity visualizations that hide within-group variability (e.g. a bar chart without error bars) would elicit more harmful stereotyping than visualizations that emphasize within-group variance (e.g. a jitter plot).

Author(s): Stephanie Evergreen

Publication Date: 2 Aug 2022

Publication Site: 3iap