The Berkeley Earth Land/Ocean Temperature Record

Link: https://essd.copernicus.org/articles/12/3469/2020/essd-12-3469-2020.html

Graphic:

Abstract:

A global land–ocean temperature record has been created by combining the Berkeley Earth monthly land temperature field with spatially kriged version of the HadSST3 dataset. This combined product spans the period from 1850 to present and covers the majority of the Earth’s surface: approximately 57 % in 1850, 75 % in 1880, 95 % in 1960, and 99.9 % by 2015. It includes average temperatures in 1∘×1∘ lat–long grid cells for each month when available. It provides a global mean temperature record quite similar to records from Hadley’s HadCRUT4, NASA’s GISTEMP, NOAA’s GlobalTemp, and Cowtan and Way and provides a spatially complete and homogeneous temperature field. Two versions of the record are provided, treating areas with sea ice cover as either air temperature over sea ice or sea surface temperature under sea ice, the former being preferred for most applications. The choice of how to assess the temperature of areas with sea ice coverage has a notable impact on global anomalies over past decades due to rapid warming of air temperatures in the Arctic. Accounting for rapid warming of Arctic air suggests ∼ 0.1 C additional global-average temperature rise since the 19th century than temperature series that do not capture the changes in the Arctic. Updated versions of this dataset will be presented each month at the Berkeley Earth website (http://berkeleyearth.org/data/, last access: November 2020), and a convenience copy of the version discussed in this paper has been archived and is freely available at https://doi.org/10.5281/zenodo.3634713 (Rohde and Hausfather, 2020).

Author(s): Robert A. Rohde1 and Zeke Hausfather1,2

Citation:
Rohde, R. A. and Hausfather, Z.: The Berkeley Earth Land/Ocean Temperature Record, Earth Syst. Sci. Data, 12, 3469–3479, https://doi.org/10.5194/essd-12-3469-2020, 2020.

Publication Date: 17 Dec 2020

Publication Site: Earth System Science Data

A Filmmaker Imagines a Japan Where the Elderly Volunteer to Die

Link: https://www.nytimes.com/2022/06/17/world/asia/japan-plan75-hayakawa-chie.html?smid=url-share

Excerpt:

The premise for Chie Hayakawa’s film, “Plan 75,” is shocking: a government push to euthanize the elderly. In a rapidly aging society, some also wonder: Is the movie prescient?

TOKYO — The Japanese film director Chie Hayakawa was germinating the idea for a screenplay when she decided to test out her premise on elderly friends of her mother and other acquaintances. Her question: If the government sponsored a euthanasia program for people 75 and over, would you consent to it?

….

Close to one-third of the country’s population is 65 or older, and Japan has more centenarians per capita than any other nation. One out of five people over 65 in Japan live alone, and the country has the highest proportion of people suffering from dementia. With a rapidly declining population, the government faces potential pension shortfalls and questions about how the nation will care for its longest-living citizens.

….

Aging politicians dominate government, and the Japanese media emphasizes rosy stories about happily aging fashion gurus or retail accommodations for older customers. But for Ms. Hayakawa, it was not a stretch to imagine a world in which the oldest citizens would be cast aside in a bureaucratic process — a strain of thought she said could already be found in Japan.

Euthanasia is illegal in the country, but it occasionally arises in grisly criminal contexts. In 2016, a man killed 19 people in their sleep at a center for people with disabilities outside Tokyo, claiming that such people should be euthanized because they “have extreme difficulty living at home or being active in society.”

Author(s): Motoko Rich

Publication Date: 17 June 2022

Publication Site: NYT

By Design, the Fed May Be Tightening Too Much

Link: https://www.wsj.com/amp/articles/by-design-the-fed-may-be-tightening-too-much-11655370001

Excerpt:

The Fed has often moved interest rates by 0.75 percentage point or more in recent decades. But until this week, it had always done so in a downward direction. Indeed, it was a hallmark of Fed policy that it always cut interest rates faster, with less prompting, than it raised them.

…..

This asymmetry reflected the Fed’s perception of risks. If it cut rates too little, the economy might spiral down and the financial system implode. If it cut them too much, inflation might, some years later, rise. Throughout this prepandemic period, inflation was low and, at times, too low, but that wasn’t a big deal. Moreover, during that low-inflation, low-interest-rate era, rates couldn’t fall very much — the Fed called this the “zero lower bound” — so best to act quickly to forestall a downward spiral. If inflation was a problem, there was no limit to how high rates could go.

This philosophy got taken too far. The Fed kept rates too low for too long last year (and the Biden administration enacted too much fiscal stimulus) out of a mistaken belief that inflation was a remote threat compared with prolonged high unemployment.

The result is that risks are now asymmetric in the other direction. Inflation is too high and a self-sustaining wage-price spiral is a real threat. Asked why, after carefully laying the groundwork for a half-point increase, the Fed raised rates by 0.75 point Wednesday, Mr. Powell pointed to an “eye-catching” report that showed long-term inflation expectations rising ominously.

Author(s): Greg Ip

Publication Date: 16 Jun 2022

Publication Site: WSJ

Flood-Prone Homes Could Lose Federal Insurance Under FEMA Plan

Link: https://www.wsj.com/articles/fema-urges-congress-to-drop-flood-insurance-for-highest-risk-areas-11655384400

Excerpt:

Mr. Toomey asked Jerry Theodorou of the R Street Institute, a conservative-leaning Washington-based think tank, how seriously Congress should look at paying repetitive loss claims. “Indeed, this is a very serious problem,” Mr. Theodorou said. “The numbers speak for themselves, to have such a small percentage of policyholders accounting for close to 40% of the claims dollars paid.”

The flood insurance program — which is the main provider of flood coverage in the U.S. and has issued more than five million policies — has paid out more money to property owners and other expenses than it has collected in premiums from policyholders since Congress created it in 1968. It collects about $4.6 billion in annual revenue from policyholders in premiums, fees and other charges, according to the Congressional Research Service.

Flooding ranks as the country’s most common natural disaster. Scientists predict floods will happen more frequently in neighborhoods that face new risk from rising sea levels and extreme rainstorms due to climate change.

Author(s): Katy Stech Ferek

Publication Date: 16 June 2022

Publication Site: Wall Street Journal

New Illinois Law Authorizes $1 Billion in Pension Obligation Bonds and Extends Buyout Option

Link: https://www.ai-cio.com/news/new-illinois-law-authorizes-1-billion-in-pension-obligation-bonds-and-extends-buyout-option/

Excerpt:

Illinois Governor J. B. Pritzker signed into law House Bill 4292 last Thursday [May 5]. The bill extends state employees’ ability to exercise pension buyout options to June 2026, as opposed to the previous deadline of 2024. Buyout options allow pension recipients to take a lump sum of money now as opposed to waiting to retirement to receive the pension. The hope is that doing so could decrease the state’s struggling pensions’ unfunded future liabilities.

Illinois’ state budget for fiscal year 2023 also authorized an additional $500 million in payments to the state pension fund and $1 billion in pension obligation bonds. 

…..

Illinois’ pension funds are among the worst funded in the country. As of fiscal year 2021, the state’s pension plans were 46.5% funded, significantly lower than the national average of 72.8%, according to the National Association of State Retirement Administrators.

Author(s): Anna Gordon

Publication Date: 9 May 2022

Publication Site: ai-CIO

NHTSA Releases Initial Data on Safety Performance of Advanced Vehicle Technologies

Link: https://www.nhtsa.gov/press-releases/initial-data-release-advanced-vehicle-technologies

Report for Level 2 ADAS: https://www.nhtsa.gov/sites/nhtsa.gov/files/2022-06/ADAS-L2-SGO-Report-June-2022.pdf

Report for Levels 3-5: https://www.nhtsa.gov/sites/nhtsa.gov/files/2022-06/ADS-SGO-Report-June-2022.pdf

Graphic:

Excerpt:

Today, as part of the U.S. Department of Transportation’s efforts to increase roadway safety and encourage innovation, the National Highway Traffic Safety Administration published the initial round of data it has collected through its Standing General Order issued last year and initial accompanying reports summarizing this data.

The SAE Level 2 advanced driver assistance systems summary report is available here, while the SAE Levels 3-5 automated driving systems summary report is available here. Going forward, NHTSA will release data updates monthly.

These data reflect a set of crashes that automakers and operators reported to NHTSA from the time the Standing General Order was issued last June. While not comprehensive, the data are important and provide NHTSA with immediate information about crashes that occur with vehicles that have various levels of automated systems deployed at least 30 seconds before the crash occurred.

“The data released today are part of our commitment to transparency, accountability and public safety,” said Dr. Steven Cliff, NHTSA’s Administrator. “New vehicle technologies have the potential to help prevent crashes, reduce crash severity and save lives, and the Department is interested in fostering technologies that are proven to do so; collecting this data is an important step in that effort. As we gather more data, NHTSA will be able to better identify any emerging risks or trends and learn more about how these technologies are performing in the real world.”

Publication Date: 15 June 2022

Publication Site: NHTSA

Newly Released Estimates Show Traffic Fatalities Reached a 16-Year High in 2021

Link: https://www.nhtsa.gov/press-releases/early-estimate-2021-traffic-fatalities

Report link: https://crashstats.nhtsa.dot.gov/Api/Public/ViewPublication/813298

Graphic:

Excerpt:

The National Highway Traffic Safety Administration has released its early estimate of traffic fatalities for 2021. NHTSA projects that an estimated 42,915 people died in motor vehicle traffic crashes last year, a 10.5% increase from the 38,824 fatalities in 2020. The projection is the highest number of fatalities since 2005 and the largest annual percentage increase in the Fatality Analysis Reporting System’s history. Behind each of these numbers is a life tragically lost, and a family left behind. 

“We face a crisis on America’s roadways that we must address together,” said U.S. Transportation Secretary Pete Buttigieg. “With our National Roadway Safety Strategy and the President’s Bipartisan Infrastructure Law, we are taking critical steps to help reverse this devastating trend and save lives on our roadways.” 

The Bipartisan Infrastructure Law places a strong emphasis on improving safety and includes the new Safe Streets and Roads for All program, which opened its first round of applications just this week. The program, the first of its kind, invests up to $6 billion over five years to fund local efforts to reduce roadway crashes and fatalities. The Bipartisan Infrastructure Law now being implemented also advances Complete Streets policies and standards; requires updates to the Manual on Uniform Traffic Control Devices, which defines speeds, lane markings, traffic lights and more on most roads in the country; and sharply increases funding for the Highway Safety Improvement Program, which helps states adopt data-driven approaches to making roads safer. 

Publication Date: 17 May 2022

Publication Site: NHTSA

Fed Hikes Rates 75 Basis Points; Powell Says 75 or 50 Likely in July

Link: https://www.thinkadvisor.com/2022/06/15/fed-hikes-rates-75-bps-intensifying-inflation-fight/

Graphic:

Excerpt:

The Federal Reserve raised interest rates by 75 basis points — the biggest increase since 1994 — and Chair Jerome Powell said officials could move by that much again next month or make a smaller half-point increase to get inflation under control.

Slammed by critics for not anticipating the fastest price gains in four decades and then for being too slow to respond to them, Chairman Jerome Powell and colleagues on Wednesday intensified their effort to cool prices by lifting the target range for the federal funds rate to 1.5% to 1.75%.

“I do not expect moves of this size to be common,” he said at a press conference in Washington after the decision, referring to the larger increase. “Either a 50 basis point or a 75 basis-point increase seems most likely at our next meeting. We will, however, make our decisions meeting by meeting.”

Author(s): Craig Torres

Publication Date: 15 June 2022

Publication Site: Think Advisor

Mapped: A Decade of Population Growth and Decline in U.S. Counties

Link: https://www.visualcapitalist.com/mapping-a-decade-of-us-population-growth/

Graphic:

Excerpt:

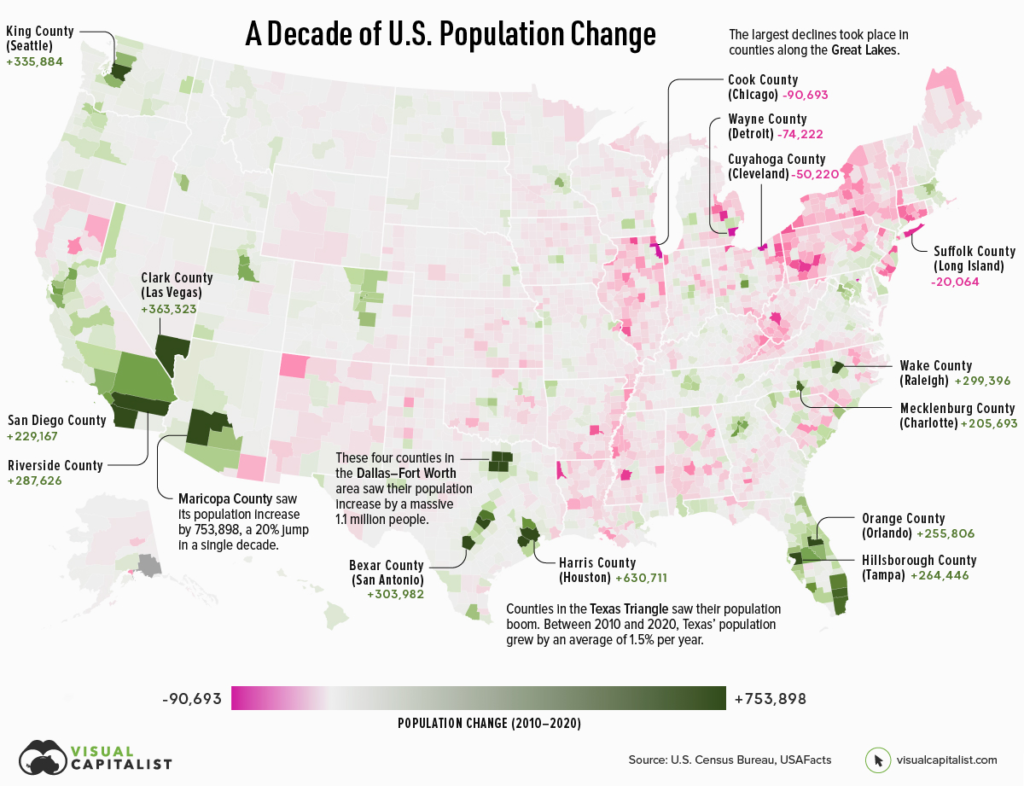
If an area sees a high number of migrants, along with a strong birth rate and low death rate, then its population is bound to increase over time. On the flip side, if more people are leaving the area than coming in, and the region’s birth rate is low, then its population will likely decline.

Which areas in the United States are seeing the most growth, and which places are seeing their populations dwindle?

This map, using data from the U.S. Census Bureau, shows a decade of population movement across U.S. counties, painting a detailed picture of U.S. population growth between 2010 and 2020.

Author(s): Nick Routley
Article/Editing: Carmen Ang

Publication Date: 16 Jun 2022

Publication Site: Visual Capitalist

Childhood Mortality Trends, 1999-2021 (provisional), Ages 1-17

Link: https://marypatcampbell.substack.com/p/childhood-mortality-trends-1999-2021

Graphic:

Excerpt:

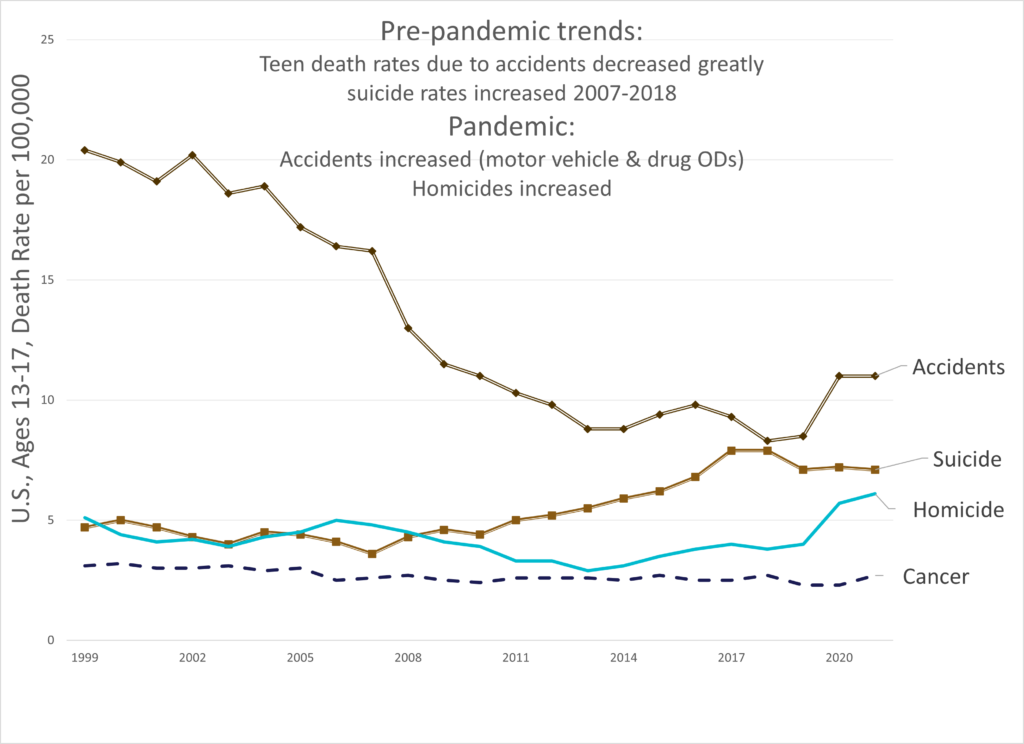
There was the good news from before the pandemic: the accidental death rate had come way, way down. That was mostly due to improved traffic safety. (Not reduced drug ODs, alas)

In the pandemic, both increased motor vehicle deaths and drug overdoses has pushed up the accidental death rate for teens to increase to levels seen a decade ago.

But there was a bad pre-pandemic trend: suicide rates had increased from 2007 to 2018 — increasing a total of 120% over that period. That was hideous.

It seemed to have reversed in 2019, and come down during the pandemic. The suicide trends in the pandemic really made no sense to anybody, but perhaps the increased drug ODs were actually suicides.

Homicides didn’t have a steady trend before the pandemic, but has definitely had a bad trend during the pandemic. Homicide death rates for teens increased over 50% from 2019 to 2021.

One observation: suicide and homicide death rates used to be about the same for teens in the early 2000s, and then with the bad suicide trend, suicide ranked higher. Even with the increase in homicide rates, suicide still ranks higher.

Author(s): Mary Pat Campbell

Publication Date: 15 June 2022

Publication Site: STUMP at substack

Recent Trends in Heat-Related Mortality in the United States: An Update through 2018

Link: https://journals.ametsoc.org/view/journals/wcas/13/1/wcas-d-20-0083.1.xml

DOI: https://doi.org/10.1175/WCAS-D-20-0083.1

Graphic:

Abstract:

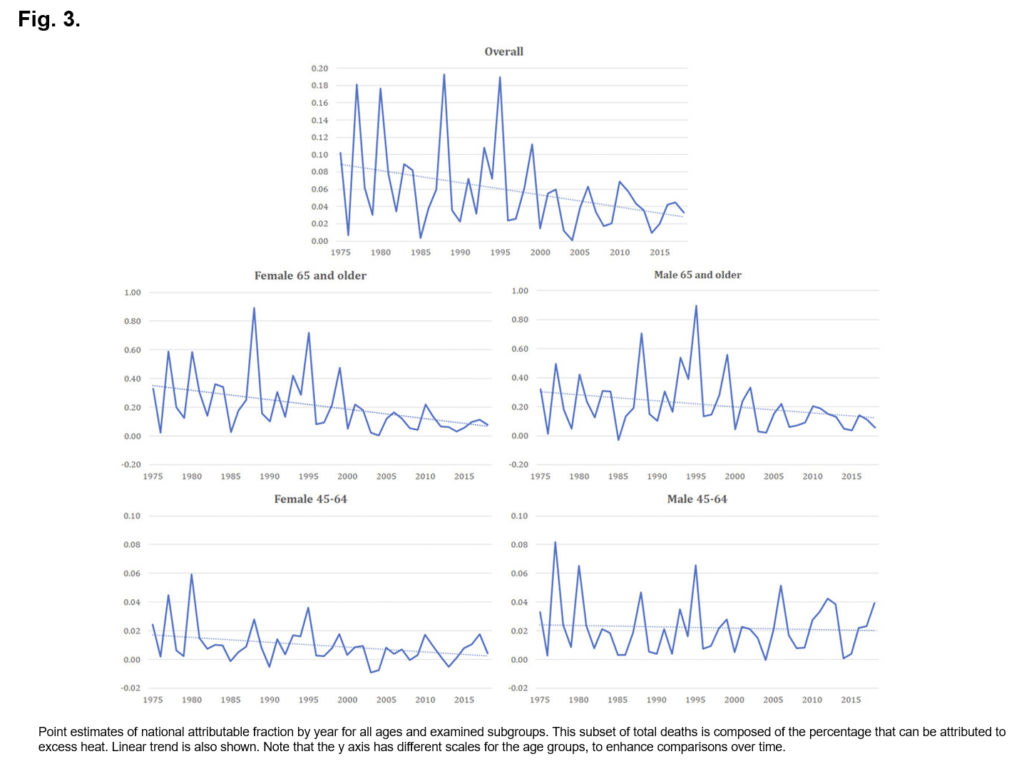
Much research has shown a general decrease in the negative health response to extreme heat events in recent decades. With a society that is growing older, and a climate that is warming, whether this trend can continue is an open question. Using eight additional years of mortality data, we extend our previous research to explore trends in heat-related mortality across the United States. For the period 1975–2018, we examined the mortality associated with extreme-heat-event days across the 107 largest metropolitan areas. Mortality response was assessed over a cumulative 10-day lag period following events that were defined using thresholds of the excess heat factor, using a distributed-lag nonlinear model. We analyzed total mortality and subsets of age and sex. Our results show that in the past decade there is heterogeneity in the trends of heat-related human mortality. The decrease in heat vulnerability continues among those 65 and older across most of the country, which may be associated with improved messaging and increased awareness. These decreases are offset in many locations by an increase in mortality among men 45–64 (+1.3 deaths per year), particularly across parts of the southern and southwestern United States. As heat-warning messaging broadly identifies the elderly as the most vulnerable group, the results here suggest that differences in risk perception may play a role. Further, an increase in the number of heat events over the past decade across the United States may have contributed to the end of a decades-long downward trend in the estimated number of heat-related fatalities.

Author(s): Scott C. Sheridan1, P. Grady Dixon2, Adam J. Kalkstein3, and Michael J. Allen4

Publication Date: Published-online: 14 Dec 2020

Print Publication: 01 Jan 2021

Publication Site: Weather, Climate, and Society

Biden Administration Sues a City Over “Rampant Overspending on Teacher Salaries”

Link: https://www.educationnext.org/biden-administration-sues-a-city-over-rampant-overspending-on-teacher-salaries/

Excerpt:

The Biden administration’s Securities and Exchange Commission is suing the city of Rochester, New York, contending that “rampant overspending on teacher salaries” plunged the Rochester school district into “extreme financial distress,” misleading investors who bought municipal bonds.

The legal action is unusual. Sure, the federal government’s interaction with K-12 education has often extended beyond the bounds of the U.S. Department of Education. The Department of Agriculture administers the school lunch program, and the Department of Defense operates schools serving military-connected children. Under George W. Bush, the Justice Department toyed with the idea of using antitrust law to support charter schools. And in the waning days of the Trump administration, President Trump issued an executive order authorizing “emergency learning scholarships” to be provided via the Secretary of Health and Human Services.

But, notwithstanding Bloomberg columnist Matt Levine’s theory that
everything is securities fraud,” in practice, the K-12 education beat hasn’t intersected greatly with the fraud provisions of federal securities laws. At least until now.

….

How much has Rochester been “overspending?” The website Seethroughny.com, a project of the Empire Center for Public Policy, lists 717 Rochester City School District Employees who earned more than $100,000 in 2019. The district has about 25,000 K-12 public school students, according to the state of New York. Spending runs about $20,000, a little below the statewide average. Whether that amounts to “overspending” probably depends on one’s view of how much the children are learning, and also one’s view of whether the students could learn more, and how much more, if more money were spent.

….

In practice, the legal aspects of the case will probably turn more on considerations about disclosure to potential bond buyers than about the details of the spending on teacher salaries.

Even so, the mere mention of securities law and bondholders as potential tools to curb school district “overspending” is intriguing, especially when the action comes under a president who campaigned promising to increase school spending so as to pay teachers “competitive salaries.” For years, reformers have complained that teachers unions capture school boards and run school systems for the benefit of adults rather than children. Now a different set of influential adults—bondholders—is, in a way, asserting, via the SEC, its own claim that could be a countervailing force.

Author(s): Ira Stoll

Publication Date: 15 June 2022

Publication Site: Education Next