Link:https://marypatcampbell.substack.com/p/2021-us-mortality-news-explainer?s=w
Graphic:
Excerpt:
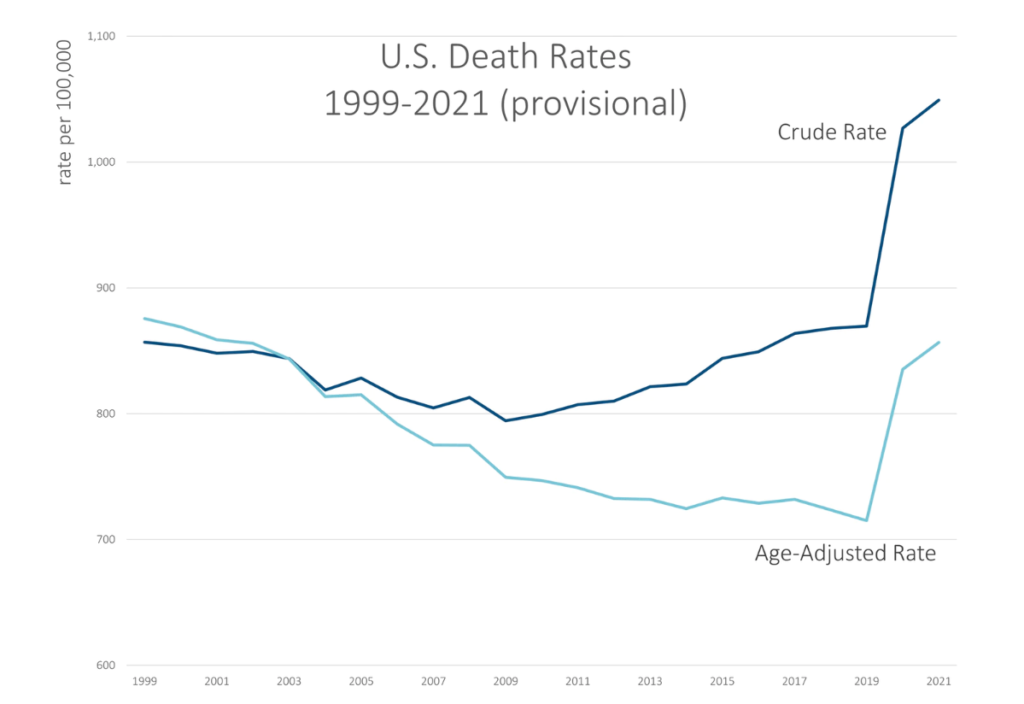
Here’s a graph for 1999 through the provisional 2021 result (as of 3 April 2022 data from CDC WONDER):
You can see the crude rate is higher than the age-adjusted rate for most of the years, and that’s due to the aging of the population. Basically, the Boomers have been getting older, and their older ages (and higher mortality compared to where they were in 2000), have an effect on how many deaths there are overall — thus the crude rate continually increasing as there are more and more old people.
However, until the pandemic hit, the age-adjusted death rate in general decreased, though we had a few years in the 2010s in which the age-adjusted death rate did increase… and yes, that was due to drug overdoses. We will get to that in a bit.
In any case, both the crude rate and age-adjusted rates did jump up by a lot in 2020 due to the pandemic, and COVID deaths were even higher in 2021. But there were other causes of death also keeping mortality rates high in 2021.
I will point out that even with all this extra mortality, the age-adjusted death rate in 2021 is still below where it was in 1999.
That does not mean things are hunky-dory.
This is one of the dangers of collapsing death rates into a single number. The increase in death rates has differed by age group, and it has been far worse for teens and young adults through even young middle-age than it has been for the oldest adults.
Yes, COVID has killed the oldest adults the most, but their death rates have increased the least. It’s all relative.
Author(s): Mary Pat Campbell
Publication Date: 13 Apr 2022
Publication Site: STUMP at substack