Link: https://marypatcampbell.substack.com/p/motor-vehicle-accident-deaths-part?s=w
Graphic:

Excerpt:
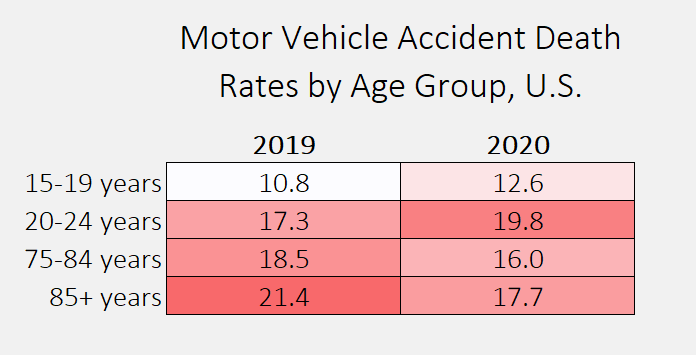
The rates are per 100,000 people for the year, but the point is who has the highest, and we see that the answer is:
For 2019: age 85+
For 2020: age 20-24
I threw in the age 15-19 group as ringers, by the way. When we get to all the age groups, they’re not even #4 in the ranking.
Just in that little table, you can see that the rates went up for the youngsters and dropped for the seniors. Think about why that might be.
As noted in my polling question, I’m not adjusting for the number of miles driven, and I’m not going to dig for that data now. But would you like to make some assumptions about the driving habits of these different groups? Especially during the pandemic?
Author(s): Mary Pat Campbell
Publication Date: 2 March 2022
Publication Site: STUMP at substack