The Fed Is ‘Normalizing.’ Here’s What Public Financiers Need to Know.

Link: https://www.governing.com/finance/the-fed-is-normalizing-heres-what-public-financiers-need-to-know

Graphic:

Excerpt:

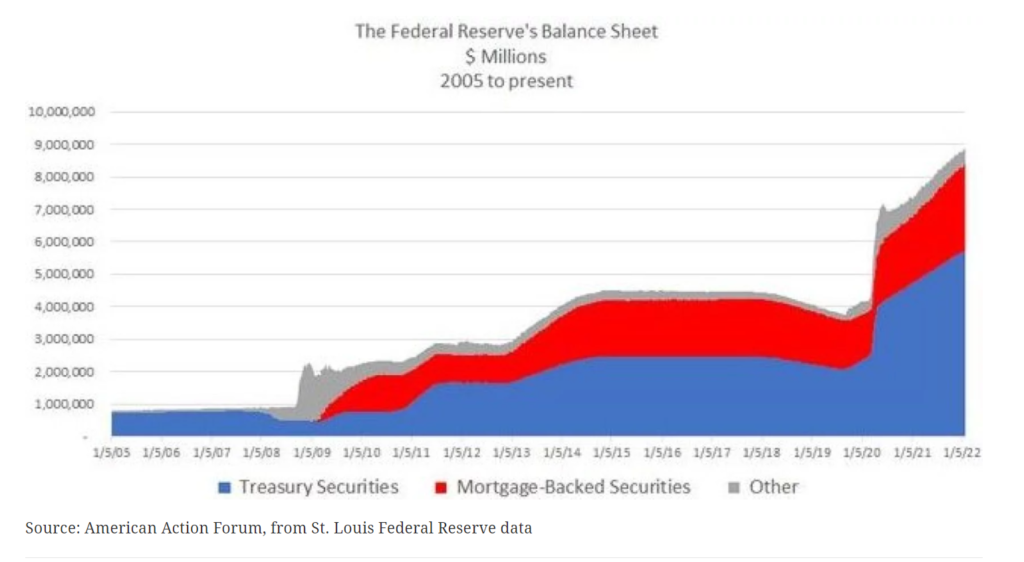
Of the $8.3 trillion of liquid marketable securities in the Fed’s portfolio (see the chart below), 37 percent are overnight repos and Treasury securities maturing in one year or less, 26 percent are T-notes maturing in one to five years, and another 30 percent are mortgage-backed securities issued by Fannie Mae and Freddie Mac, which pay down principal and interest monthly. So all it takes to pull back the excessive monetary stimulus left over from the COVID-relief era is to let such holdings roll off in 2022-24 without replacing them with new purchases. Operationally, it’s really not rocket science — it’s just a matter of conviction and messaging. Unlike the rising stairstep expected in the Fed’s overnight rates, its bond portfolio runoff won’t make nightly news headlines; it’s like watching paint dry. In this regard, doing nothing is actually doing something quite constructive on the inflation front, despite the lack of fanfare.

What would be the impact on interest rates? Little doubt they must go higher, barring an exogenous shock like a global virus lockdown or a Ukraine-war flight-to-safety. The key question is really how much higher, and how fast. My best guess is that markets have recently discounted about one-third of the potential move higher in long-term rates.

Author(s): Girard Miller

Publication Date: 15 Feb 2022

Publication Site: Governing

Interpreting Pandemic-Related Decreases in Life Expectancy

Link:https://www.actuary.org/node/14837

Graphic:

Excerpt:

Period life expectancy measures demonstrate fluctuations that reflect events that influenced mortality in this particular period.14 For example, the Spanish flu pandemic of 1918 resulted in a dramatic decrease in period life expectancy, which was more than offset by an increase in period life expectancy the next year. A male baby born in 1917 had a period life expectancy of 52.2 years, while a male baby born in 1918 had a period life expectancy of only 45.3 years—a reduction of almost 7 years.15 The following year, a male newborn had a period life expectancy of 54.2, an increase of almost 9 years over the period life expectancy calculated in 1918 for a newborn male. These changes are much larger than those seen thus far with COVID-19, demonstrating the relative severity of that earlier pandemic relative to the current one.

It is instructive to review the impact of calculating life expectancies on a cohort basis, rather than a period basis, for these three cohorts of male newborns in the late 1910s. Using mortality rates published by the SSA for years after 1917, for a cohort of 1917 male newborns, the average life span was 59.4; for the 1918 cohort, average life span was 60.0; and for 1919, it was 61.5. Even these differences are heavily influenced by the fact that the 1917 and 1918 cohorts had to survive the high rates of death during 1918, while the 1919 cohort did not.

If both period and cohort life expectancy are measured as of 1920 for each of these groups (the 3-year-old children who were born in 1917, 2-year-old children who were born in 1918 and 1-year-old children who were born in 1919), differences are observed in these measures as they narrow substantially because the high rates of mortality during 1918 have no effect on those who survived to 1920. This is summarized in the table below.

Author(s): Pension Committee

Publication Date: December 2021

Publication Site: American Academy of Actuaries

State Individual Income Tax Rates and Brackets for 2022

Link:https://taxfoundation.org/state-income-tax-rates-2022

Graphic:

Excerpt:

Individual income taxes are a major source of state government revenue, accounting for 36 percent of state tax collections in fiscal year 2020, the latest year for which data are available.

Forty-two states levy individual income taxes. Forty-one tax wage and salary income, while one state—New Hampshire—exclusively taxes dividend and interest income. Eight states levy no individual income tax at all.

Of those states taxing wages, nine have single-rate tax structures, with one rate applying to all taxable income. Conversely, 32 states and the District of Columbia levy graduated-rate income taxes, with the number of brackets varying widely by state. Hawaii has 12 brackets, the most in the country.

States’ approaches to income taxes vary in other details as well. Some states double their single-bracket widths for married filers to avoid a “marriage penalty.” Some states index tax brackets, exemptions, and deductions for inflation; many others do not. Some states tie their standard deductions and personal exemptions to the federal tax code, while others set their own or offer none at all.

Author(s): Timothy Vermeer, Katherine Loughead

Publication Date: 15 Feb 2022

Publication Site: Tax Foundation

Clarifying Misunderstanding of Life Expectancy and COVID-19

Link:https://www.actuary.org/sites/default/files/2022-02/EELifeExpectancy.pdf

Graphic:

Excerpt:

Basically, there are two life expectancy measures—
period life expectancy and cohort life expectancy.
Period life expectancy generally is based on the
assumption that current rates of death continue
indefinitely. Cohort life expectancy is more heavily
influenced by long-term expectations. Period life
expectancies can vary dramatically from one year to the
next when there is a short-term increase in mortality.

….

Period life expectancy can be a
useful metric for year-over-year
comparisons in normal times but
tends to exaggerate the effect of
nonrecurring events. Cohort life
expectancy is likely what most people
envision when thinking about the
concept of life expectancy because
cohort life expectancy is an estimate
of the actual number of years
that a typical individual might be
expected to live based on reasonable
expectations for future conditions.
For this reason, cohort life expectancy
is the measure used by the Actuaries
Longevity Illustrator that can help
individuals estimate how long they
might live.

Publication Date: Feb 2022

Publication Site: American Academy of Actuaries

Comptroller asks for upgrade to Illinois’ worst-in-nation credit

Link:https://www.thecentersquare.com/illinois/comptroller-asks-for-upgrade-to-illinois-worst-in-nation-credit/article_464a70c6-8862-11ec-b879-afe32c50f8c6.html utm_term=0_3386e99c24-8d6a8659cc-71461060

Excerpt:

Illinois Comptroller Susana Mendoza is asking the credit ratings agencies to upgrade Illinois’ worst-in-the-nation status.

S&P Global has Illinois at BBB. Moody’s has the state at Baa2. That’s after upgrades from the agencies last year. Fitch has Illinois at BBB-.

“My office is doing everything possible to manage the current backlog of bills and address Illinois’ finances head-on,” Mendoza said in a letter to the agencies that her office announced Monday. “The Illinois Office of Comptroller urges you to consider these positive factors and progress made in strengthening Illinois’ financial position when evaluating Illinois’ creditworthiness.”

Mendoza said in the letter she has paid back recent borrowing from a federal program. Illinois was the only state to borrow from the Federal Reserve’s Municipal Liquidity Fund for a total of $2.6 billion.

Author(s): Greg Bishop

Publication Date: 8 Feb 2022

Publication Site: The Center Square

Investors Sour on Muni Funds

Link:https://www.wsj.com/articles/investors-sour-on-muni-funds-11643568253

Graphic:

Excerpt:

Investors pulled $1.4 billion from municipal-bond funds in the week ended last Wednesday, the biggest weekly outflow since the early days of the pandemic, according to Refinitiv Lipper.

Municipal-bond yields, which rise as prices fall, climbed last week after the Federal Reserve signaled it would begin steadily raising interest rates in mid-March, reducing the appeal of outstanding debt. Yields on the highest-rated state and local bonds jumped to 1.55% Monday from 1.34% last Tuesday, according to Refinitiv MMD.

Returns on the S&P Municipal Bond Index have fallen to minus 2.33% this year through Jan. 28, counting price changes and interest payments, the lowest year-to-date returns in at least 16 years.

Author(s): Heather Gillers

Publication Date: 31 Jan 2022

Publication Site: WSJ

Providence Pension Working Group

Link:https://www.providenceri.gov/wp-content/uploads/2022/01/PVDPensionWorkingGroup_Jan312022.pdf

Graphic:

Excerpt:

Decisions made more than 30 years ago drive challenges. The seeds of the City’s
pension problems were sown more than three decades ago when the City promised
unsustainable benefit increases to members of the retirement system without
funding the associated annual Actuarily Determined Contribution (ADC).2


The severity of the situation makes Providence an outlier. The City of Providence’s
Employee Retirement System (ERS) is among the lowest funded pension plans in
the nation. Since 1991, the City’s unfunded pension liability increased by more than
$1 billion. In addition to the pension liabilities, and over and above the pension
shortfall, the City’s retiree health benefits are underfunded by approximately $1.1
billion.3
The unfunded liability of the ERS drives costs to City that outpace revenue
growth, limiting investments in other priorities. As of June 30, 2020, the ERS was
only 22.2 percent funded.4 Total pension liabilities equated to $8,518 per resident –
of which $6,629 is not funded.5 In the last twenty years, the City’s unfunded liability
per capita increased by $4,000 per resident.

Publication Date: January 2022

Publication Site: Providence RI

Providence needs $500M bond to fix pension shortfall, report states

Link:https://www.bizjournals.com/rhodeisland/news/2022/02/01/providence-needs-500m-bond-to-fix-pension-shortfa.html

Excerpt:

A coalition of civic leaders is recommending that Providence issue a $500 million bond to address the city’s massive unfunded pension obligation.

“Doing nothing is simply not an option,” the Pension Working Group wrote in a 27-page report issued Monday. The group of public officials, working with business and nonprofit leaders, released its recommendations after six months spent studying the city’s staggering pension liability problem.

Providence’s pension plan is funded at 22%, making it one of the weakest employee retirement systems in the nation. Since 1991, the city’s unfunded liability has grown by more than $1 billion, and that doesn’t include a $1.1 billion shortfall in retiree health benefits.

“Current and future retiree liabilities are unsustainable,” the report states.

Author(s): Mary Serreze

Publication Date: 1 Feb 2021

Publication Site: Providence Business First

Suggested reforms for Pennsylvania’s Public School Employees’ Retirement System

Link:https://reason.org/commentary/suggested-reforms-for-the-pennsylvania-teacher-pension-system/?utm_medium=email

Graphic:

Excerpt:

Despite realizing excellent investment returns in 2021, industry capital market forecasts continue to suggest persistently volatile near-term investment returns that stand to only add to over $1 trillion in current pension funding shortfalls. Most near-term investment outlooks we’ve seen from pension boards across the country predict anywhere from a 6.0 percent-6.3 percent return over the next 10 years. PSERS’ assumed rate of return was recently lowered and currently sits at 7 percent.*

PSERS’s investment outlook is similar to these broad projections. Figures 1 and 2 present the results of the Monte Carlo simulation analysis developed by the Pension Integrity Project. This iterative analysis uses 10,000 simulations of PSERS’s asset performance over 20 years, considering expected returns and volatilities of plan assets, to generate both probabilities of hitting certain returns and expected return distributions.

These findings suggest that PSERS is not likely to achieve even a 6 percent average return over the next 10-15 years—much less its current assumed return of 7 percent. This suggests there is a high probability that the public pension plan’s unfunded liabilities could get worse, not better, in the near-to-mid term. This underperformance—relative to the plan’s own return rate assumptions—will make the system’s long-term solvency challenges even larger.

Author(s): Jordan Campbell, Ryan Frost

Publication Date: 11 Oct 2021

Publication Site: Reason

Utah changed its drunk driving threshold and crash fatality numbers dropped

Link:https://thehill.com/changing-america/resilience/smart-cities/593871-utah-changed-its-drunken-driving-threshold-and-crash

Excerpt:

In 2017, the governor of Utah enacted a law that lowered the legal blood alcohol concentration to .05 percent from the previous limit of .08 percent.

New research found that the law resulted in a nearly 20 percent reduction in fatal car crashes.

The Centers for Disease Control and Prevention estimates every day 29 people in the country die in motor vehicle crashes that involve an alcohol-impaired driver.

Author(s): Shirin Ali

Publication Date: 11 Feb 2022

Publication Site: The Hill

COVID-19 cases rise every day in Denmark, but the country is confident it can live without restrictions for now

Link:https://www.abc.net.au/news/2022-02-13/denmark-has-taken-living-with-covid-to-a-whole-new-level/100812736

Graphic:

Excerpt:

At the beginning of February, the Danish government decided COVID-19 was no longer a “socially critical disease” and it scrapped all restrictions.

Danes aren’t even legally required to quarantine.

Denmark was among the first countries in the world to implement a lockdown, in March 2020, amid the rapid spread of COVID-19.

It also invested heavily in genomic sequencing to track new variants like the BA.2 sub-variant of Omicron, which is now dominant in Denmark and even more transmissible than the original strain.

And when the Omicron variant began spreading rapidly last year, Denmark reimposed restrictions on workplaces, hospitality and schools in December.

But Tyra Grove Krause, the chief epidemiologist at Denmark’s State Serum Institute, said it also sparked a major rethink in the country’s approach to COVID-19.

Author(s): Nick Dole

Publication Date: 12 Feb 2022

Publication Site: ABC News Australia

CPI Jumps Most Since February 1982, Up at Least 0.5% 9 Out of Eleven Months

Link:https://mishtalk.com/economics/cpi-jumps-most-since-february-1982-up-at-least-0-5-9-out-of-eleven-months

Graphic:

Excerpt:

The Consumer Price Index for All Urban Consumers (CPI-U) increased 0.6 percent in January on a seasonally adjusted basis.

The index for all items less food and energy also rose 0.6 percent in January, the same increase as in December. 

This was the 9th time in the last 11 months the CPI increased at least 0.5 percent.

Increases in the indexes for food, electricity, and shelter were the largest contributors to the seasonally adjusted all items increase in January.

Author(s): Mike Shedlock

Publication Date: 10 Feb 2022

Publication Site: Mish Talk