Graphic:

Excerpt:
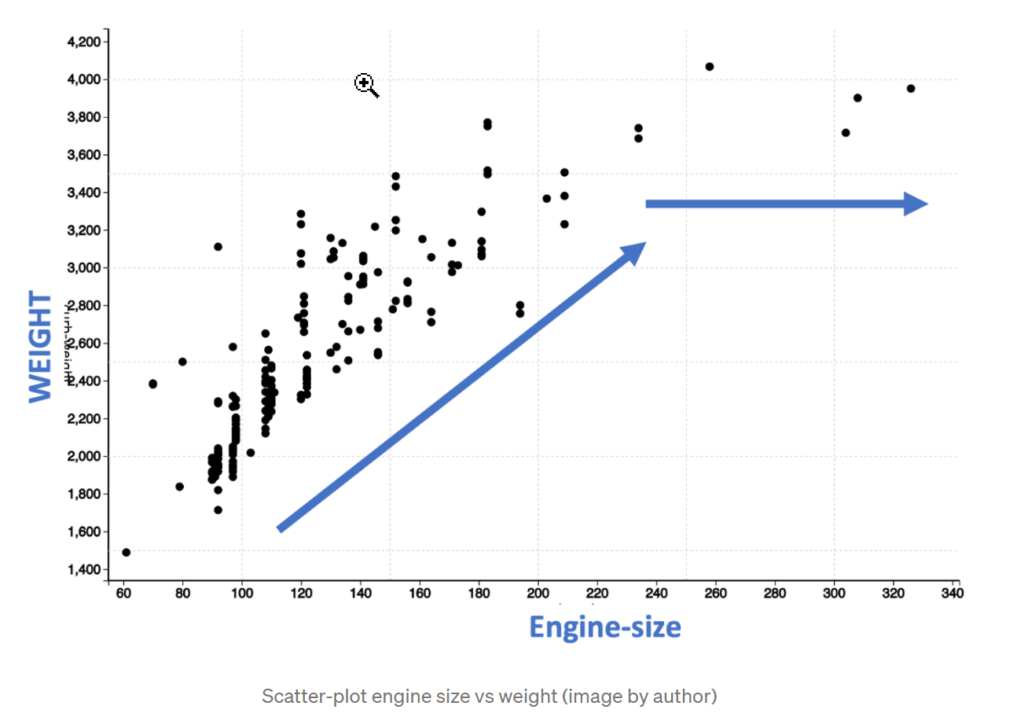
Just looking at these dots, we see that for engine size between 60 and 200, there is a linear increase in the weight. However, after an engine size of 200, the weight does not increase linearly but is leveling. So, this means that the relation between engine size and weight is not strictly linear.
We can also confirm the non-linear nature by performing a linear curve fit as shown below with a blue line. You will observe that the points marked in the red circle are completely off the straight line indicating that a linear line does not correctly capture the pattern.
We started by looking at the color of the cell which indicated a strong correlation. However, we concluded that it is not true when we looked at the scatter plot. So where is the catch?
The problem is in the name of the technique. As it is titled a correlation matrix, we tend to use it to interpret all types of correlation. The technique is based on Pearson correlation, which is strictly measuring only linear correlation. So the more appropriate name of the technique should be linear correlation matrix.
Author(s): Pranay Dave
Publication Date: 4 Jan 2022
Publication Site: Towards Data Science