Want to Be an Actuary? Odds Are, You’ll Fail the Test

Link:https://www.wsj.com/articles/actuary-credential-test-exam-bad-odds-11640706082?st=52aicn5y38okulw&reflink=article_email_share

Graphic:

(the answer: B — I’ll leave it to you to verify the calculations)

Excerpt:

Actuaries quantify risk. One of their riskiest endeavors is trying to become one.

Among people taking at least one exam from the Society of Actuaries—the field’s biggest U.S. credentialing body—15% eventually pass the multiple tests required to become an Associate, one of two designations allowing them to practice. Just 10% pass those and additional tests to become a Fellow, the group’s higher designation, which affords bigger responsibilities and salaries.

It’s such an arduous process that the number of test-takers has been declining in recent years, and the society is making changes to keep candidates from dropping out of the gantlet. It is also adding new “predictive analytics” tests to adjust to the massive amounts of data insurers now have.

There is no limit to how many times a candidate can take the tests. It took one man 50 years to become a Fellow, says Stuart Klugman, an official at the society. The society says a candidate typically takes seven to 10 years to become a Fellow. They must pass 10 exams plus other coursework and requirements.

Author(s): Neal Templin

Publication Date: 28 Dec 2021

Publication Site: WSJ

The Fed’s Doomsday Prophet Has a Dire Warning About Where We’re Headed

Link:https://www.politico.com/amp/news/magazine/2021/12/28/inflation-interest-rates-thomas-hoenig-federal-reserve-526177

Excerpt:

In May of 2020, Hoenig published a paper that spelled out his grim verdict on the age of easy money, from 2010 until now. He compared two periods of economic growth: The period between 1992 and 2000 and the one between 2010 and 2018. These periods were comparable because they were both long periods of economic stability after a recession, he argued. The biggest difference was the Federal Reserve’s extraordinary experiments in money printing during the latter period, during which time productivity, earnings and growth were weak. During the 1990s, labor productivity increased at an annual average rate of 2.3 percent, about twice as much as during the age of easy money. Real median weekly earnings for wage and salary employees rose by 0.7 percent on average annually during the 1990s, compared to only 0.26 percent during the 2010s. Average real gross domestic product growth — a measure of the overall economy — rose an average of 3.8 percent annually during the 1990s, but by only 2.3 percent during the recent decade.

The only part of the economy that seemed to benefit under quantitative easing and zero-percent interest rates was the market for assets. The stock market more than doubled in value during the 2010s. Even after the crash of 2020, the markets continued their stellar growth and returns. Corporate debt was another super-hot market, stoked by the Fed, rising from about $6 trillion in 2010 to a record $10 trillion at the end of 2019.

Author(s): Christopher Leonard

Publication Date: 28 Dec 2021

Publication Site: Politico

Year-End 2021 Capital Markets Wrap-Up

Link:https://content.naic.org/sites/default/files/capital-markets-special-report-YE%202021%20wrap%20up.pdf

Graphic:

Excerpt:

The U.S. economy has made a solid recovery as COVID-19 vaccinations were made increasingly
available, social distancing began to ease, and businesses gradually reopened.
The International Monetary Fund (IMF), among other forecasters, expects the U.S. economy to
grow by about 6% in 2021, after contracting about 3.4% in 2020.
• Inflation reached a 39-year high of 6.8% in November following a strong rebound from the COVID19-induced recession.
• The ‘stronger for longer’ inflation rates prompted the Federal Reserve to accelerate the tapering
of its asset purchases and to suggest the likelihood of three rate hikes in 2022.
• The 10-year U.S. government bond yield has generally ranged between 1.3% and 1.7% in 2021,
increasing from less than 1% in 2020, due in part to fiscal stimulus aiding in economic recovery.
• Credit spreads have been muted in 2021 given robust global economic growth, favorable funding
conditions, and overall solid corporate performance despite higher costs and supply disruptions.
• Global stocks have achieved relatively high returns; in the U.S., the Standard & Poor’s (S&P) 500
posted seven record closing highs in November alone.
• The price of oil reached a seven-year high of $85 per barrel in 2021 as demand for oil normalized
while the global supply market tightened.

Author(s): : Jennifer Johnson and Michele Wong

Publication Date: 22 Dec 2021

Publication Site: NAIC Capital Markets Bureau Special Reports

CT to borrow over $1.3 billion to fund a long list of state, local projects

Link:https://ctmirror.org/2021/12/21/ct-to-borrow-over-1-3-billion-to-fund-a-long-list-of-state-local-projects/

Excerpt:

Gov. Ned Lamont helped to hand out more than $1.3 billion on Tuesday by voting to have the state borrow money to pay for various infrastructure projects, state grant programs, improvements at a mental health center in Bridgeport and a new train station in Enfield.

In total, the State Bond Commission, which Lamont leads, agreed to fund more than 50 different projects, programs and initiatives — some of which were championed by state lawmakers who are heading into a campaign season next year and are eager to bring home financial wins to their district.

….

The more than $1 billion in spending that was approved Tuesday will be financed through state revenue and general obligation bonds, which Connecticut officials market to Wall Street investors and will eventually need to repay with interest.

Connecticut frequently relies on that type of borrowing capacity to finance school construction efforts, capital projects at state universities, transportation upgrades, building maintenance projects, land preservation deals and the smaller community projects that often benefit state legislators. This week’s meeting marked the third bond commission gathering this year.

State legislators largely control the first step in the borrowing process by adopting a two-year bond package, but after that, the governor and the executive branch get to decide what gets funded and when.

Author(s): Andrew Brown

Publication Date: 21 Dec 2021

Publication Site: CT Mirror

I come to bury Build Back Better, and dance on its grave

Link:https://marypatcampbell.substack.com/p/i-come-to-bury-build-back-better

Graphic:

Excerpt:

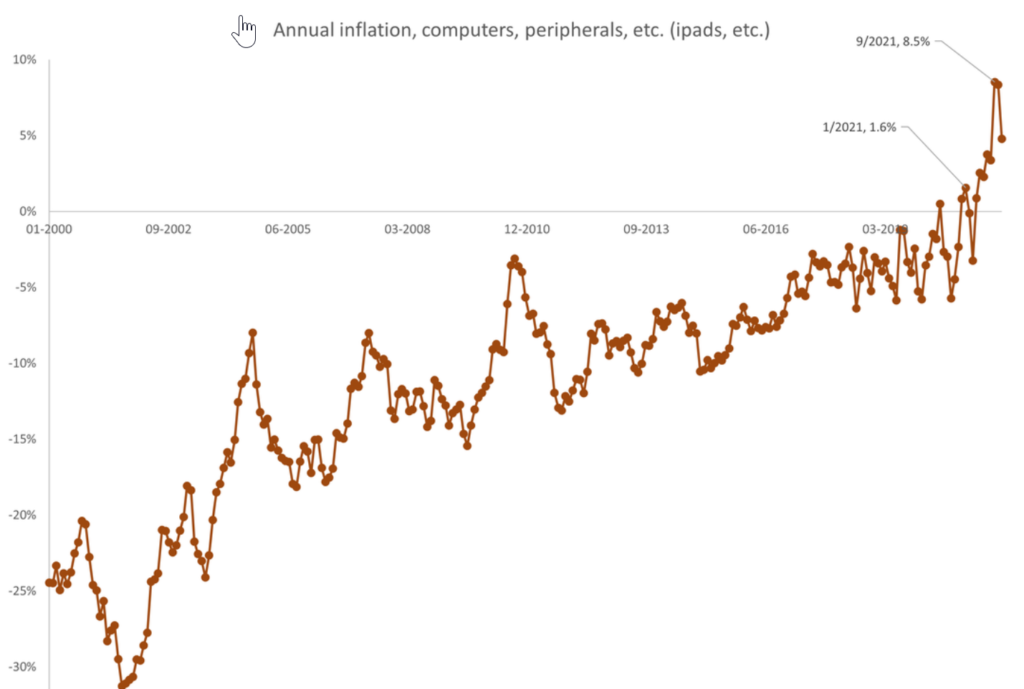
Productivity gains in consumer electronics have not been able to exceed the erosion of the currency’s value.

Bills such as Build Back Better are just a piece of the reason — we have more coming. We have a huge demographic issue, and a huge Social Security and Medicare bill not yet paid. Shoveling out more money and writing more IOUs will not help matters.

So, RIP, BBB. Please stay dead.

Author(s): Mary Pat Campbell

Publication Date: 21 Dec 2021

Publication Site: STUMP at substack

New Census Data Shows Population Increased at Lowest Rate in US History

Link:https://mishtalk.com/economics/new-census-data-shows-population-increased-at-lowest-rate-in-us-history

Graphic:

Excerpt:

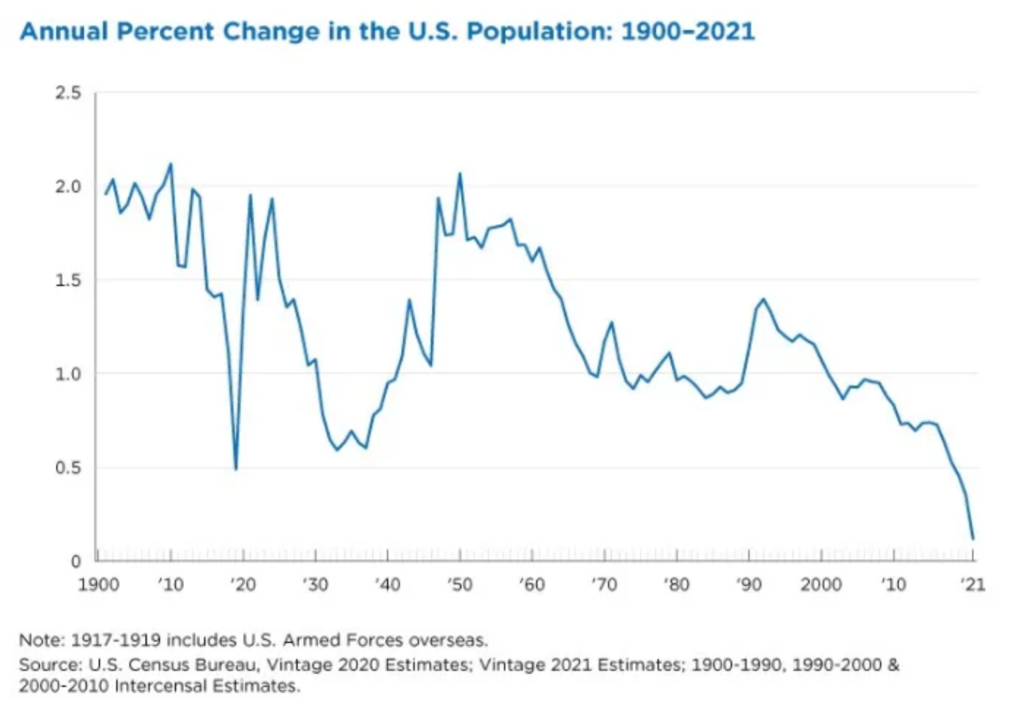
The population of the United States grew in the past year by 392,665, or 0.1%, the lowest rate since the nation’s founding. 

The slow rate of growth can be attributed to decreased net international migration, decreased fertility, and increased mortality due in part to the COVID-19 pandemic.

Between July 1, 2020, and July 1, 2021, the nation’s growth was due to natural increase (148,043), which is the number of excess births over deaths, and net international migration (244,622). 

This is the first time that net international migration (the difference between the number of people moving into the country and out of the country) has exceeded natural increase for a given year.

The voting-age resident population, adults age 18 and over, grew to 258.3 million, comprising 77.8% of the population in 2021.

Author(s): Mike Shedlock

Publication Date: 21 Dec 2021

Publication Site: Mish Talk

Omicron Is an Economic Threat, but Inflation Is Worse, Central Bankers Say

Link:https://www.nytimes.com/2021/12/16/business/economy/omicron-inflation.html

Excerpt:

Facing surging inflation, three of the world’s most influential central banks — the Federal Reserve, Bank of England and European Central Bank — took decisive steps within 24 hours of each other to look past Omicron’s economic uncertainty.

On Thursday, Britain’s central bank unexpectedly raised interest rates for the first time in more than three years as a way to curb inflation that has reached a 10-year high. The eurozone’s central bank confirmed it would stop purchases under a bond-buying program in March. The day before, the Fed projected three interest rate increases next year and said it would accelerate the wind down of its own bond-buying program.

….

Aside from Omicron, the central banks were running out of reasons to continue emergency levels of monetary stimulus designed to keep money flowing through financial markets and to keep lending to businesses and households robust throughout the pandemic. The drastic measures of the past two years had done the job — and then some: Inflation is at a nearly 40-year high in the United States; in the eurozone it is the highest since records began in 1997; and price rises in Britain have consistently exceeded expectations.

….

The Federal Reserve and Bank of England are worried about the persistence of high inflation. For the European Central Bank, inflation in the medium term is too low, not too high. It is still forecasting inflation to be below its 2 percent target in 2023 and 2024. To help reach that target in coming years, the central bank will increase the size of an older bond-buying program beginning in April, after purchases end in the larger, pandemic-era program. This is to avoid “a brutal transition,” Ms. Lagarde said.

Author(s): Eshe Nelson

Publication Date: 16 Dec 2021

Publication Site: New York Times

Influence of the Peltzman effect on the recurrent COVID-19 waves in Europe

Link:https://pmj.bmj.com/content/early/2021/04/28/postgradmedj-2021-140234

Excerpt:

Epidemiologists report there is no precise definition for what is or is not an epidemic wave. ‘Waves’ are a phenomenon of infections that can develop during a pandemic. A wave implies a rising number of sick patients, a characteristic peak of illness and then a dramatic or sustained decline of infections reaching a baseline.1 Previous experiences with the Spanish influenza pandemic (1918) and seasonal influenza epidemics suggest further waves of COVID-19 are inevitable.2 The UK has endured the first two waves of the COVID-19 pandemic with widespread socioeconomic consequences and mortality.3 The WHO regional office for Europe has recently reported that incidence, hospitalisations and deaths in Central Europe, the Balkans and the Baltic states are among the highest globally suggesting a third wave of COVID-19.4 The reason for this third wave in Europe and anticipated further waves in countries with vaccine roll-out including the UK could be due to the Peltzman effect.

The Peltzman effect is named after Sam Peltzman, professor of economics at the University of Chicago Booth School of Business. It describes the concept of ‘Risk Compensation’.5 In this concept, it is argued that highway safety regulations were not reducing highway deaths. ‘Risk compensation’ is a theory that suggests that people typically adjust their behaviour in response to perceived levels of risk. It postulates that people become more careful where they sense greater risk and lesser careful if they feel more protected. Peltzman theorised that though the introduction of safety devices, like seat belts or air bags, reduced the ratio of fatalities to accidents, the rate of accidents was found to have risen enough to offset the decreased fatality rate. He proposed that though people felt safer driving with a seat belt, it probably led to a phenomenon of driving with less attentiveness or higher speed causing an increased risk of run-off-road crashes or similar accidents.

…..

COVID-19 vaccination triggering Peltzman effect—An analysis of Peltzman effect reveals four main factors contributing to risk compensation, all of which appear to be present in the current COVID-19 pandemic. To initiate an increase in risky behaviour, a measurable benefit must be ‘visible’, a criterion that COVID-19 vaccines meet. This is supported by the decreasing number of infections in vaccinated populations.7 Risk compensation is more likely to occur if people have a ‘motivation’ to take on a risky behaviour and if it is within their ‘control’ to do so. With the COVID-19 pandemic these two factors seem to have manifested as ‘pandemic fatigue’ with decreasing adherence to risk reduction strategies of social distancing, face coverings and hand washing in the population. Such behaviours of risk compensation have raised concerns about threat to global public health efforts to control the pandemic.8 The final factor, the overall effectiveness of the intervention, in this case of the COVID-19 vaccine, is being increasingly recognised worldwide.9 This is highly desirable, increasing the likelihood of vaccine-acquired ‘herd immunity’. However, for the Peltzman effect, this high efficacy is likely to reduce adherence to other safety precautions. Vaccination drives in most European countries started in late December 2020, after which the rise of cases was seen. Thus, people’s complacency and a false sense of increased security after vaccination may have been the possible reasons for people to abandon protective and preventive behavioural strategies.

Author(s): Karthikeyan P Iyengar1, http://orcid.org/0000-0003-1701-4970Pranav Ish2, http://orcid.org/0000-0001-7998-2980Rajesh Botchu3, http://orcid.org/0000-0003-4164-7380Vijay Kumar Jain4, http://orcid.org/0000-0002-9577-9533Raju Vaishya5

Publication Date: April 2021

Publication Site: BMJ Journals

Tiering Up – The Unfinished Business of Public Pension Reform in New York

Link:https://www.empirecenter.org/publications/tieringup/

PDF of report: https://www.empirecenter.org/wp-content/uploads/2021/12/Tiering-Up_FINAL-Copy.pdf

Graphic:

Excerpt:

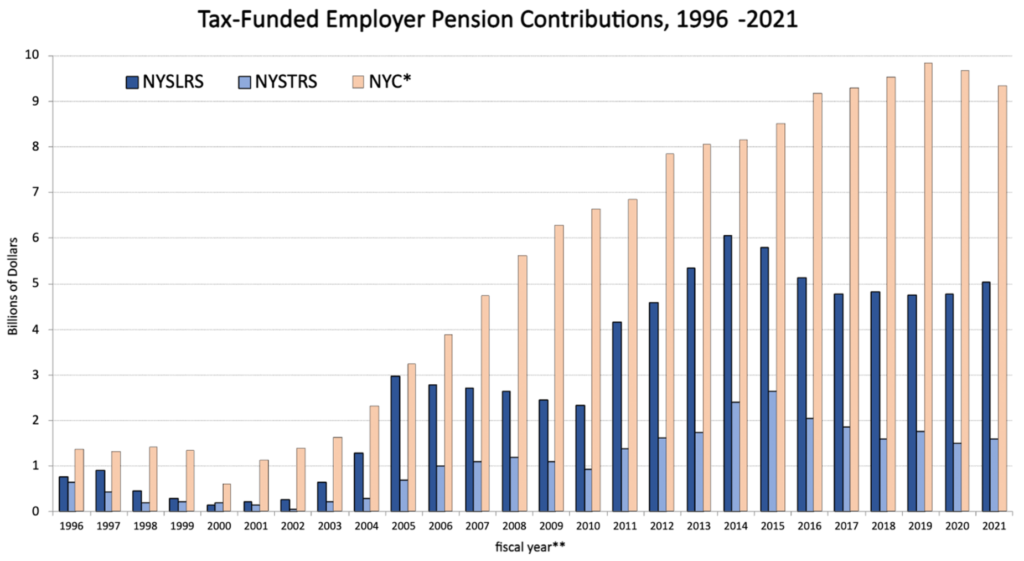
The Tier 5 and Tier 6 changes combined are saving New York state and local governments outside New York City more than $1 billion this year.

After record-busting investment returns in 2021, most of the state’s public pension plans report they are fully funded—but adjusting for financial risk, their combined unfunded liabilities still total nearly $400 billion.

The traditional defined-benefit pension system remains biased in favor of career and long-term employees, to the disadvantage of those who work shorter government careers.

Author(s): E.J. McMahon

Publication Date: 14 Dec 2021

Publication Site: Empire Center

Ancient Plagues

Link:https://astralcodexten.substack.com/p/ancient-plagues

Excerpt:

But the 1918 Spanish flu has, as far as I know, legitimately died out. Lots of people like saying that in a sense it’s still with us. This NEJM paper (with a celebrity author!) points out that it’s the ancestor of all existing flu strains. But most of these flu strains are less infectious than it was. This didn’t make sense to me the first, second, or third time I asked about it: why would a flu evolve into an inferior flu? Sure, it might evolve into a less deadly flu because it’s perfectly happy being more infectious but less deadly. But I think the Spanish flu was also especially infectious; so why would it evolve away from that?

One possible answer is “because by 1919, everyone had immunity to the 1918 flu, so it evolved away from it – and now nobody has immunity, but it lost the original blueprint.” The 1918 flu was a really optimal point in fluspace, but during all of history up until 1918, the flu’s evolutionary hill-climbing algorithm didn’t manage to find that point, and since flu has no memory it’s not going to be any easier for it to find it the second time, after it evolved away from it. So plausibly, existing flus are strictly worse at their job than Spanish flu was, and digging up an intact copy of the latter would be really bad.

And then there’s smallpox. No mystery why smallpox died out – we killed it. But then we stopped vaccinating people against it, and now if it comes back it would be really bad.

Author(s): Scott Alexander

Publication Date: 14 Dec 2021

Publication Site: Astral Codex Ten

Major Divergences: ECB Says No Hikes in 2022, Fed Sees 3 Hikes, BOE Hiked Today

Link:https://mishtalk.com/economics/major-divergences-ecb-says-no-hikes-in-2022-fed-sees-3-hikes-boe-hiked-today

Graphic:

Excerpt:

How many rate hikes are coming? The Fed thinks 6 by the end of 2023. I am unconvinced the Fed gets in any hikes in 2022 and certainly not 6 by the end of 2023.

These ridiculous predictions assume there will not be another recession in “the longer run”. 

Central banks like to pretend they will hike, but by the time comes, they have delayed so long they find an excuse to no do so. 

Possible excuses: A recession, stock market plunge, another pandemic, global warming, global cooling, or an asteroid crash. 

Central banks will find some excuse to delay hikes. But the most likely excuse is a recession or stock market crash. 

Author(s): Mike Shedlock

Publication Date: 16 Dec 2021

Publication Site: Mish Talk

The Science of Visual Data Communication: What Works

Link: https://journals.sagepub.com/stoken/default+domain/10.1177%2F15291006211051956-FREE/full#.YbpbbYlu2Xw.twitter

doi: https://doi.org/10.1177/15291006211051956

Graphic:

image

Excerpt:

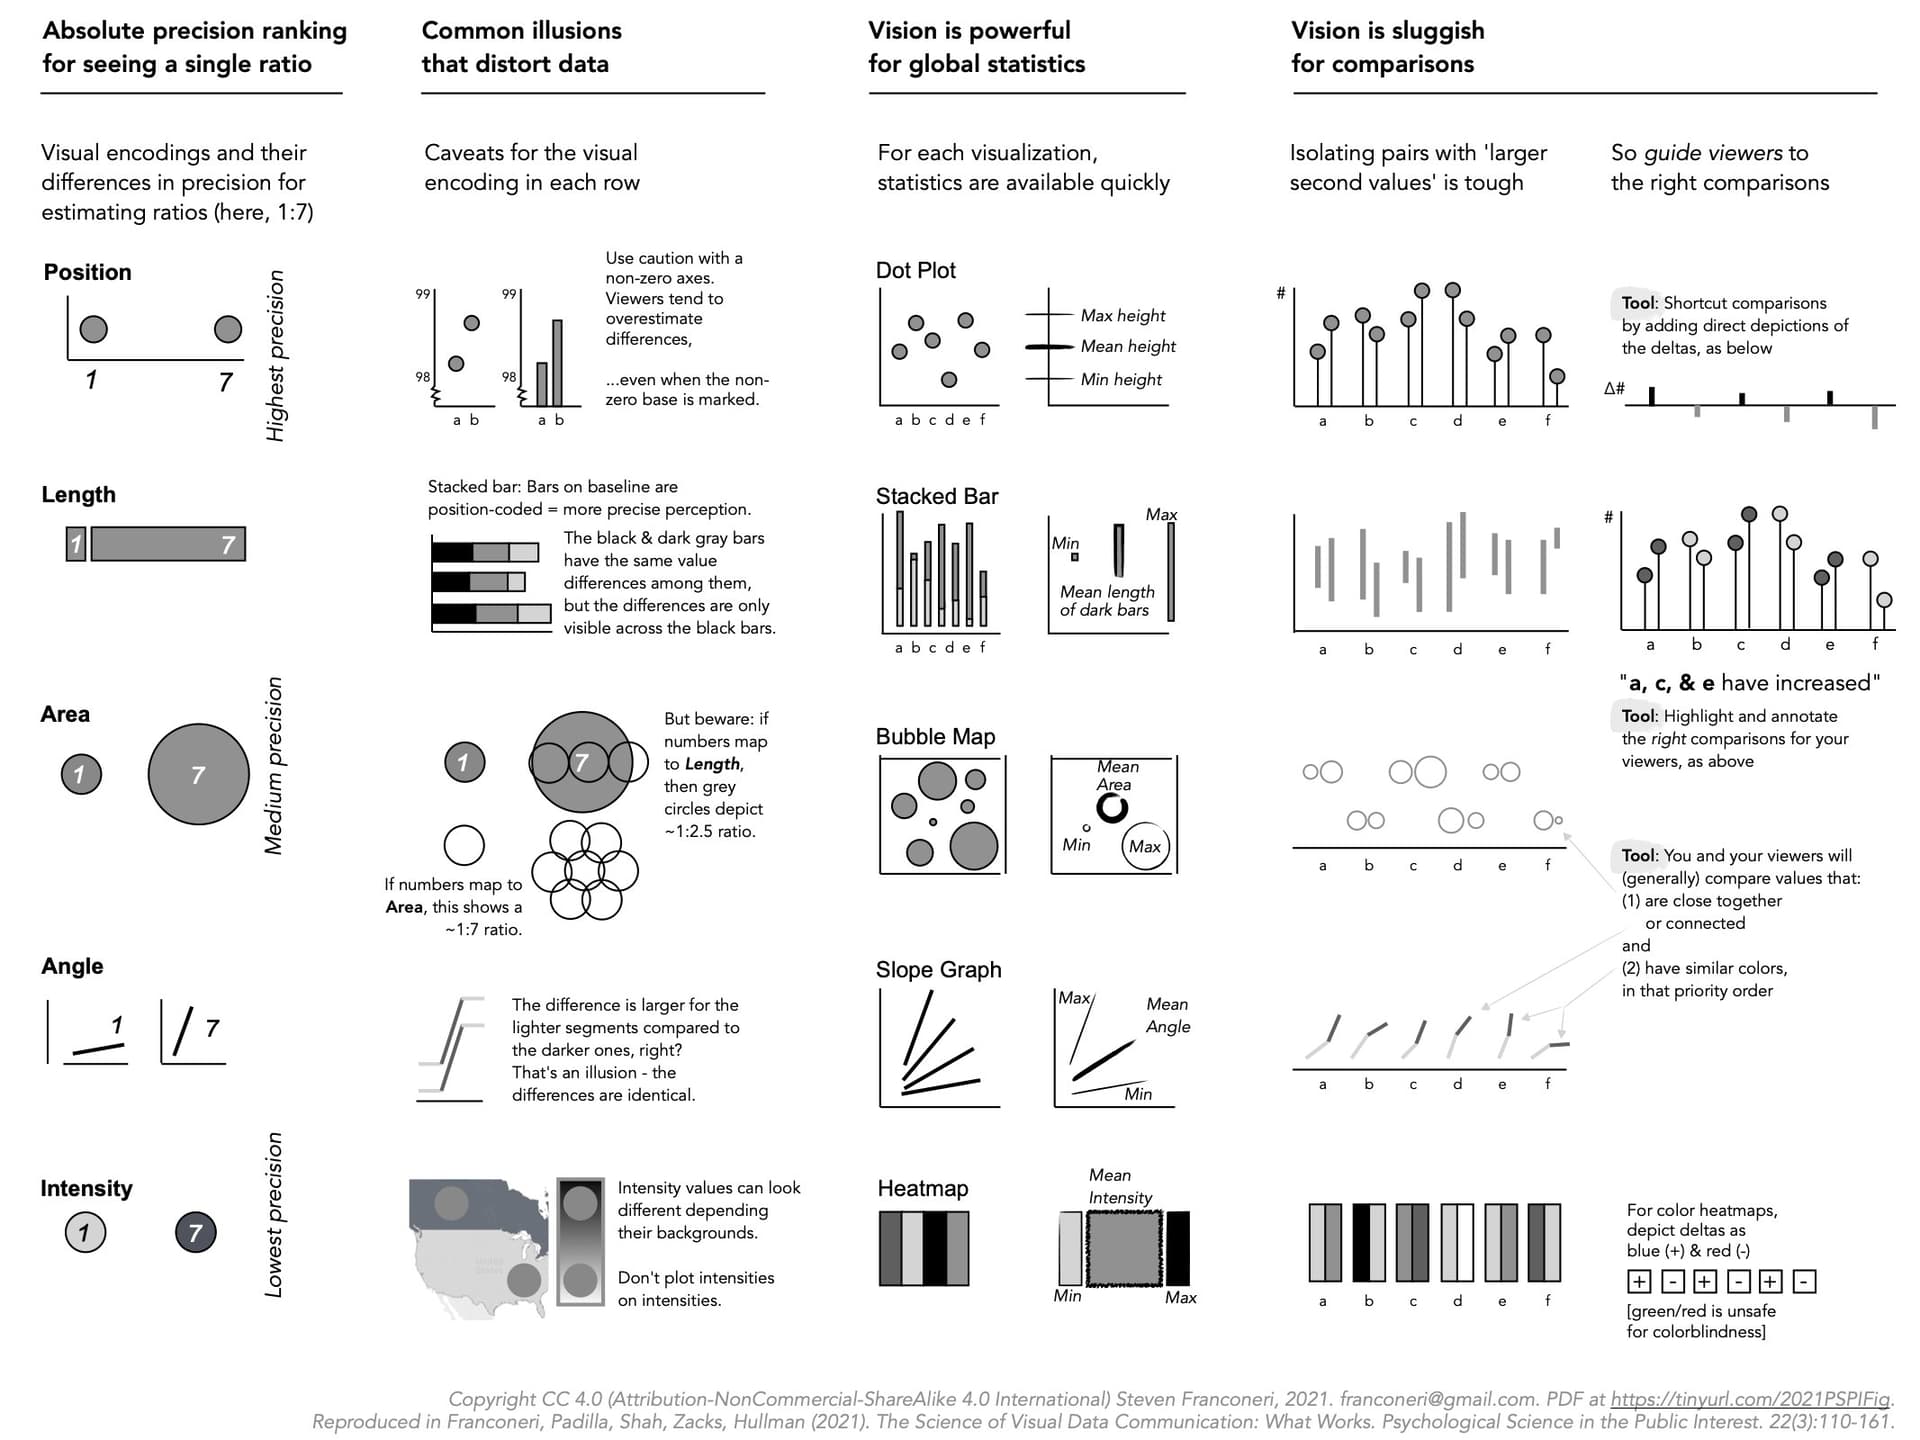
Effectively designed data visualizations allow viewers to use their powerful visual systems to understand patterns in data across science, education, health, and public policy. But ineffectively designed visualizations can cause confusion, misunderstanding, or even distrust—especially among viewers with low graphical literacy. We review research-backed guidelines for creating effective and intuitive visualizations oriented toward communicating data to students, coworkers, and the general public. We describe how the visual system can quickly extract broad statistics from a display, whereas poorly designed displays can lead to misperceptions and illusions. Extracting global statistics is fast, but comparing between subsets of values is slow. Effective graphics avoid taxing working memory, guide attention, and respect familiar conventions. Data visualizations can play a critical role in teaching and communication, provided that designers tailor those visualizations to their audience.

Author(s):
Steven L. Franconeri, Lace M. Padilla, Priti Shah, Jeffrey M. Zacks, Jessica Hullman

Publication Date: 15 Dec 2021

Publication Site: SAGE Journals