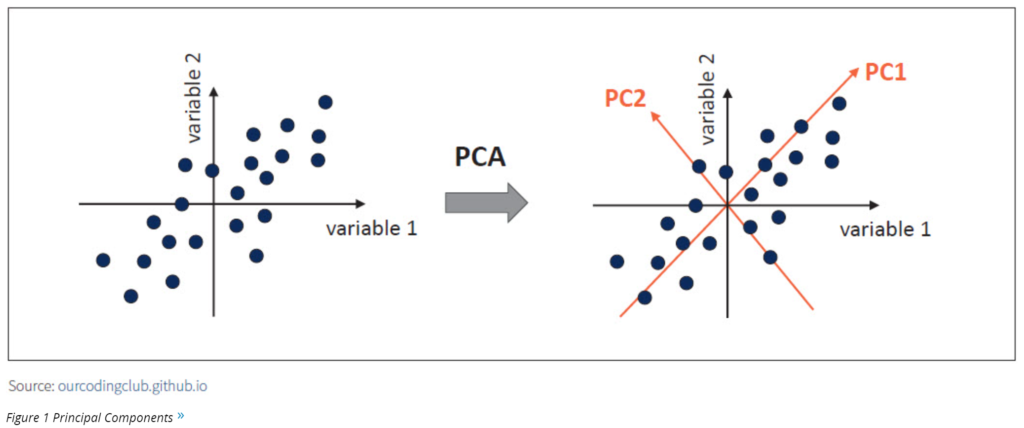
In simple words, PCA is a method of extracting important variables (in the form of components) from a large set of variables available in a data set. PCA is a type of unsupervised linear transformation where we take a dataset with too many variables and untangle the original variables into a smaller set of variables, which we called “principal components.” It is especially useful when dealing with three or higher dimensional data. It enables the analysts to explain the variability of that dataset using fewer variables.
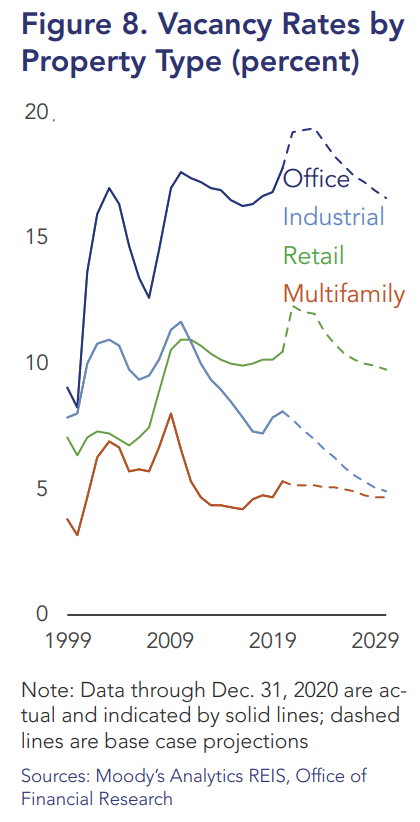
Office vacancy rates have risen modestly to 18.3% (see Figure 8). However, actual office usage has declined much more as the work-from-home response to the pandemic became widespread. This decline has had limited financial impact to date because office rentals are usually held in multiyear leases with credit-worthy tenants (see Figure 9). However, there is considerable uncertainty about whether and how demand for office space will change over the long run.
Author(s): Office of Financial Research
Publication Date: 17 Nov 2021
Publication Site: Office of Financial Research, Treasury Department
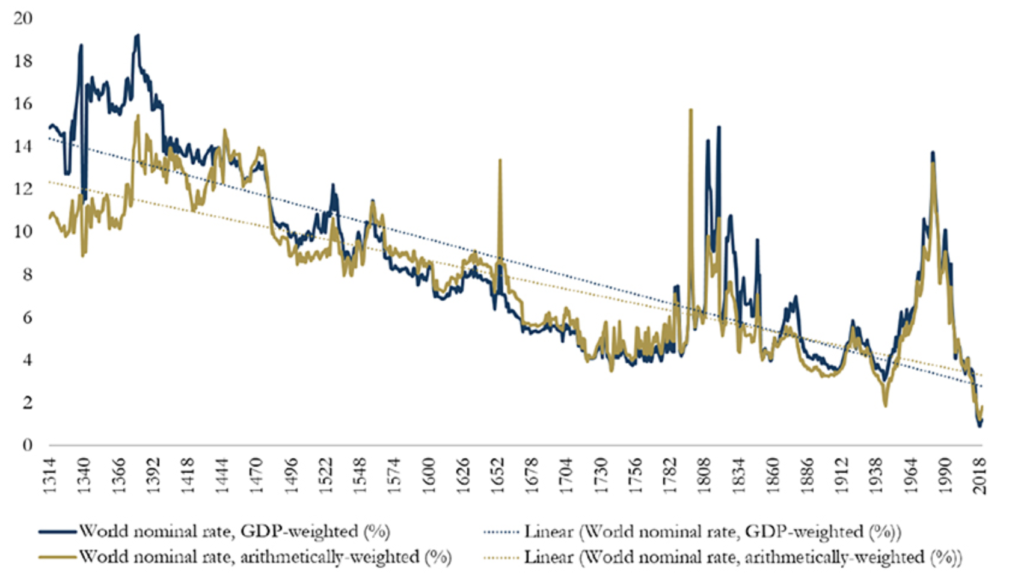
Today’s graphic from Paul Schmelzing, visiting scholar at the Bank of England (BOE), shows how global real interest rates have experienced an average annual decline of -0.0196% (-1.96 basis points) throughout the past eight centuries.
….
Starting in 1311, data from the report shows how average real rates moved from 5.1% in the 1300s down to an average of 2% in the 1900s.
The average real rate between 2000-2018 stands at 1.3%.
….
Demographics impact interest rates on a number of levels. The aging population—paired with declining fertility levels—result in higher savings rates, longer life expectancies, and lower labor force participation rates.
In the U.S., baby boomers are retiring at a pace of 10,000 people per day, and other advanced economies are also seeing comparable growth in retirees. Theory suggests that this creates downward pressure on real interest rates, as the number of people in the workforce declines.
Workers resigned from a record 4.4 million jobs in September, according to Labor Department data, and new surveys show that low-wage workers, employees of color and women outside the management ranks are those most likely to change roles. The findings signal that turnover isn’t evenly spread across the U.S. workforce even as employers across industries struggle to fill a variety of roles.
The overall percentage of people considering leaving their jobs — about three in 10, according to research by consulting firm Mercer LLC — is fairly consistent with historical trends. But sentiment varies across demographics and occupations. While front-line and low-wage positions typically see high rates of turnover, for example, employees in those roles are especially likely to leave now, Mercer found in a survey of 2,000 U.S. workers conducted in August.
….
Nearly half of low-wage and front-line workers surveyed said their pay and benefits were insufficient while 41% said they felt burned out from demanding workloads. Some 35% of Black employees and 40% of Asian employees said they were considering leaving, compared with 26% of white employees.
Most recently, the U.S. defaulted on Treasury bill payments in 1979 shortly after Congress raised the debt ceiling. According to the Congressional Research Service analysis: “In late April and early May 1979, about 4,000 Treasury checks for interest payments and for the redemption of maturing securities held by individual investors worth an estimated $122 million were not sent on time. Foregone interest due to the delays was estimated at $125,000.” The default was due to technical problems and was cured within a short period of time.
The claim that the United States has never defaulted, despite its frequent repetition, is not strictly true. Officials could make more modest and qualified claims such as “aside from a relatively minor operational snafu, the United States has not defaulted in the post-World War II era.” Such a claim lacks the power of a more sweeping generalization, but at least it’s accurate. If President Joe Biden and Treasury Secretary Janet Yellen want to seem credible, they should avoid making historic statements that are easily refuted by a small amount of Googling. If they cannot be believed about the basic reality of the federal government’s credit history, how can we believe what they say about current policy choices?
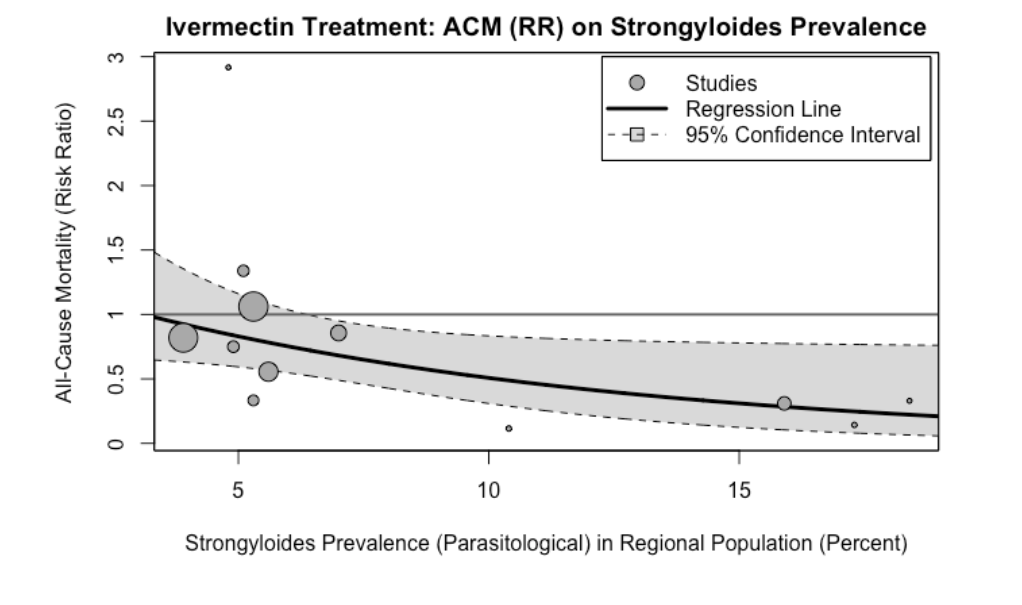
About ten years ago, when the replication crisis started, we learned a certain set of tools for examining studies.
Check for selection bias. Distrust “adjusting for confounders”. Check for p-hacking and forking paths. Make teams preregister their analyses. Do forest plots to find publication bias. Stop accepting p-values of 0.049. Wait for replications. Trust reviews and meta-analyses, instead of individual small studies.
These were good tools. Having them was infinitely better than not having them. But even in 2014, I was writing about how many bad studies seemed to slip through the cracks even when we pushed this toolbox to its limits. We needed new tools.
I think the methods that Meyerowitz-Katz, Sheldrake, Heathers, Brown, Lawrence and others brought to the limelight this year are some of the new tools we were waiting for.
Part of this new toolset is to check for fraud. About 10 – 15% of the seemingly-good studies on ivermectin ended up extremely suspicious for fraud. Elgazzar, Carvallo, Niaee, Cadegiani, Samaha. There are ways to check for this even when you don’t have the raw data. Like:
The Carlisle-Stouffer-Fisher method: Check some large group of comparisons, usually the Table 1 of an RCT where they compare the demographic characteristics of the control and experimental groups, for reasonable p-values. Real data will have p-values all over the map; one in every ten comparisons will have a p-value of 0.1 or less. Fakers seem bad at this and usually give everything a nice safe p-value like 0.8 or 0.9.
GRIM – make sure means are possible given the number of numbers involved. For example, if a paper reports analyzing 10 patients and finding that 27% of them recovered, something has gone wrong. One possible thing that could have gone wrong is that the data are made up. Another possible thing is that they’re not giving the full story about how many patients dropped out when. But something is wrong.
But having the raw data is much better, and lets you notice if, for example, there are just ten patients who have been copy-pasted over and over again to make a hundred patients. Or if the distribution of values in a certain variable is unrealistic, like the Ariely study where cars drove a number of miles that was perfectly evenly distributed from 0 to 50,000 and then never above 50,000.
At the Medical University of South Carolina, nearly all fully vaccinated Covid-19 patients in the ICU have weak immune systems from prior health problems, said Andrew Goodwin, the section chief of critical care. The rest are elderly, which can also compromise the body’s defense against illness.
Truveta Inc., a firm that aggregates hospitals’ medical data for research, found among 1.7 million fully vaccinated people that those with diabetes, chronic lung disease and chronic kidney disease were about twice as likely to be hospitalized for breakthrough cases as vaccinated people without these conditions.
The likelihood of having a breakthrough infection was still low, though confirmed infections were more common for people with these illnesses. About 1.5% of roughly 110,000 people with chronic kidney disease had one, for example. But Truveta found about a quarter of breakthrough patients with chronic kidney disease wound up hospitalized. The likelihood of hospitalizations for people with breakthrough cases but without underlying health problems was about 7.5%.
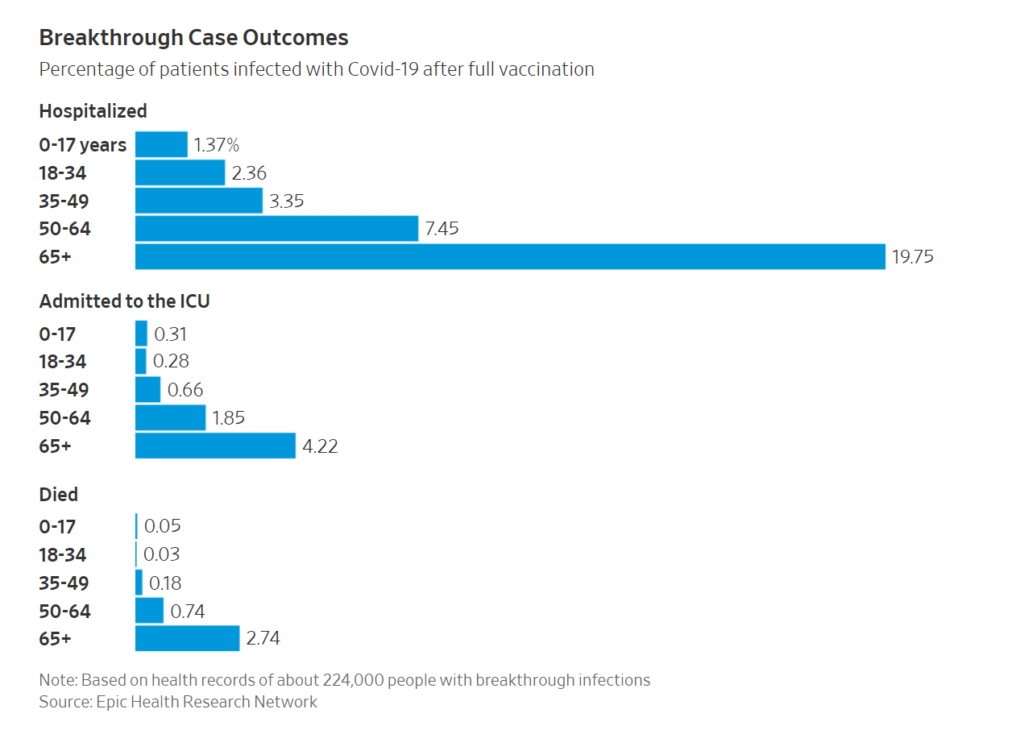
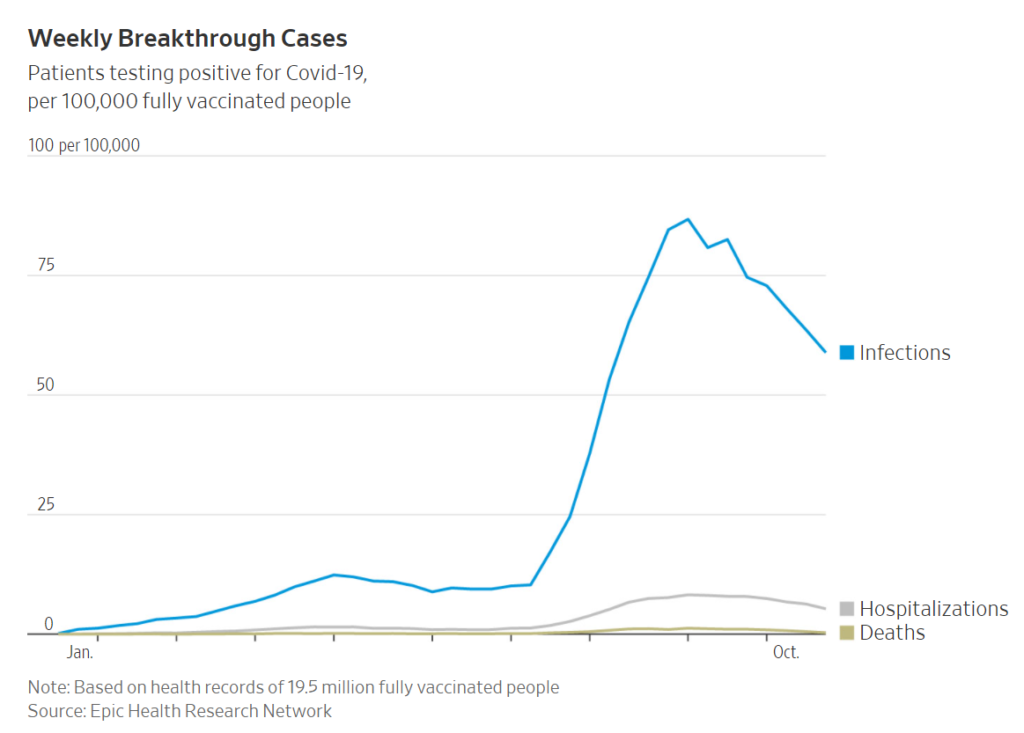
Breakthrough deaths are hitting older people the hardest, amplifying a well-worn pandemic pattern. Exclusive data the Journal reviewed from the Epic Health Research Network, which analyzes data from the medical-record software company Epic Systems Corp., shows about 80% of breakthrough deaths among the vaccinated are in people ages 65 and older. The data included records for 19.5 million fully vaccinated people. Among all Covid-19 deaths this year, that age group represents closer to 69%, according to the CDC.
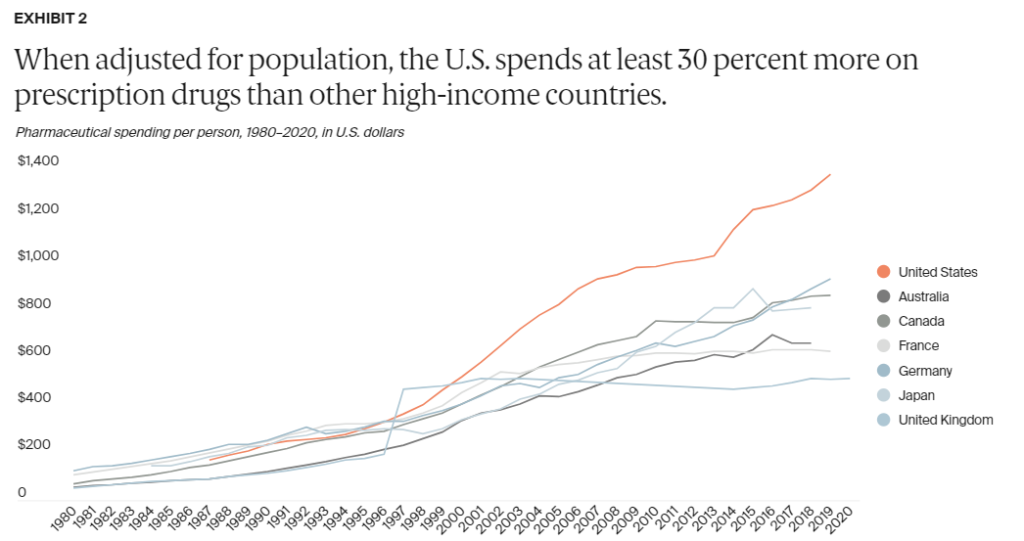
High U.S. drug prices are a financial strain for patients, employers, and state and federal governments. In the following charts, we present the findings from a number of studies on prescription drug costs and spending in the United States with other high-income countries to reveal the main culprit: high U.S. prices for brand-name drugs.
The data for this chartpack come from the following sources: the Commonwealth Fund’s 2020 International Health Policy Survey; 1980–2020 pharmaceutical spending data from the Organisation for Economic Co-operation and Development (OECD); 2020 individual-level administrative claims or registry data compiled by the International Collaborative on Costs, Outcomes, and Needs in Care (ICCONIC); and IQVIA’s MIDAS database for 33 OECD member countries for 2018.
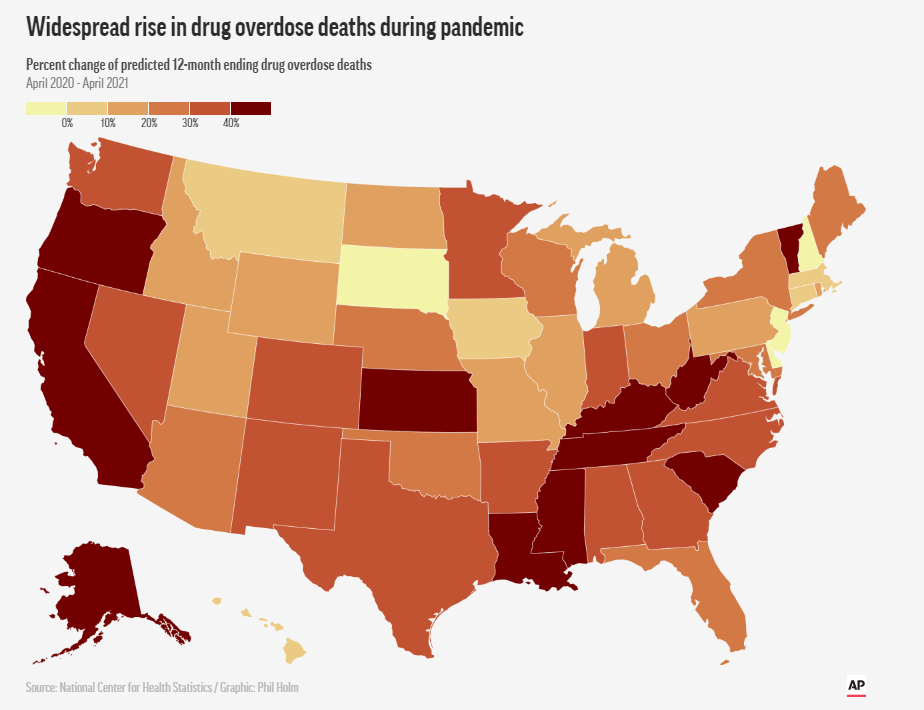
From May 2020 through April 2021, more than 100,000 people died from drug overdoses in the US, according to provisional data released Wednesday by the US Centers for Disease Control and Prevention.
That’s a horrible new record for drug overdose deaths — a near-30% rise from the same period a year earlier and a near-doubling over the past five years.
The drug epidemic grew in tandem with the Covid-19 pandemic, which claimed about 509,000 deaths in the same period.
The CalPERS board voted Monday to select a portfolio with a return of 6.8% and an expected volatility rate of 12.1%. This expected rate of return is two-tenths of a percentage point lower than last year’s target of 7%. The vote concluded a review of the pension fund’s assets, which occurs once every four years.
This expected reduction in the rate of return means that some employees will have to contribute more to their pension funds because the fund expects to earn less from its investment portfolio.
For employees hired after the implementation of the Public Employees’ Pension Reform Act (PEPRA) in January 2013, CalPERS estimates they will contribute an average of 1.2% to 1.5% more toward their pensions. These changes will go into effect for school employees, excluding teachers, in July 2022 and will be enacted for most other local government employees in July 2023.
An estimated 100,000 Americans died of drug overdoses in one year, a never-before-seen milestone that health officials say is tied to the COVID-19 pandemic and a more dangerous drug supply.
Overdose deaths have been rising for more than two decades, accelerated in the past two years and, according to new data posted Wednesday, jumped nearly 30% in the latest year.
President Joe Biden called it “a tragic milestone” in a statement, as administration officials pressed Congress to devote billions of dollars more to address the problem.
“This is unacceptable and it requires an unprecedented response,” said Dr. Rahul Gupta, director of National Drug Control Policy.
Experts believe the top drivers of overdose deaths are the growing prevalence of deadly fentanyl in the illicit drug supply and the COVID-19 pandemic, which left many drug users socially isolated and unable to get treatment or other support.