This file describes analysis that was done by the Resource Watch team for Facebook to be used to display increased temperatures for select countries in their newly launched Climate Science Information Center. The goal of this analysis is to calculate the average monthly and annual temperatures in numerous countries at the national and state/provincial level and globally from 1950 through 2020.
Check out the Climate Science Information Center (CSIC) for up to date information on climate data in your area from trusted sources. And go to Resource Watch to explore over 300 datasets covering topics from food, forests, water, oceans, cities, energy, climate, and society. This analysis was originally performed by Kristine Lister and was QC’d by Weiqi Zhou.
TCRS made $13.6 billion in fiscal 2021; a record high in earnings that put the balance of TCRS’ investments at $65.3 billion. In fiscal 2020, the system had a 4.94% return and finished the fiscal year with a balance of $53.4 billion. The Tennessee Department of Treasury said that return outearned its peers by four times the median 1.2% return during the fiscal year.
“When retirement plans around the nation are under scrutiny for their performance, TCRS is thriving,” Tennessee Treasurer David Lillard said. “Our Governor and General Assembly ensure the plan is fully funded every year. The Tennessee Department of Treasury strives to be good stewards of the state’s financial resources. This $13.6 billion in investment income is evidence of our commitment to both active and retired members of the TCRS pension plan.”
Omarova’s most out-there academic ideas include directing the Federal Reserve to handle consumer deposits, taking that power away from banks. “Having Americans park their money at the Fed would allow the central bank to more directly and efficiently pull the levers of monetary policy by enabling it to credit individual citizens’ accounts when there’s a need to stimulate the economy,” notesPolitico.
Rob Nichols, president of the American Bankers Association, has said such policies would “effectively nationalize America’s community banks,” according to The New YorkTimes. Omarova “wants to eliminate the banks she’s being appointed to regulate,” agrees the Wall Street Journal editorial board. Groups representing both big and small banks, including the American Bankers Association, the Consumer Bankers Association, and the Independent Community Bankers of America, have reached out to more moderate Democrats to lodge their opposition to the pick—a ballsy move, given that she may end up passing down the rules that these associations’ members must later comply with.
SALT deductibility does create serious issues, however. SALT was the largest itemized deduction, allowing itemizers to export a substantial portion of their burdens onto other Americans through the federal tax code. If I faced a 30percent federal marginal tax rate, paying $100 more in SALT lowers my federal tax bill by $30. It only costs me $70. Because that subsidy rises the more property is owned and the higher the income of the owner, the distortion overwhelmingly favors the richest, with the middle-class (who own less property, earn less, and face lower marginal tax rates) getting far smaller benefits, and non-itemizers getting no subsidy at all. In the process, it also subsidizes high state and local tax states at others’ expense.
Even when citizens do not feel they get their money’s worth from SALT-financed services, federal deductibility still subsidizes those governments, increasing their incentives to act in ways contrary to citizens’ interests. No wonder Democrats in high budget/high tax states are so strident in supporting deductibility. In the example above, federal income tax deductibility means that as long as a local citizen believes such spending provides more than 70 cents of value per dollar of spending, and they don’t take into account the added federal burdens they must bear from those similarly subsidized elsewhere, they think they gain. That encourages those governments to do more of what they should not do and more of what they do badly, not more of what their citizens find worth doing.
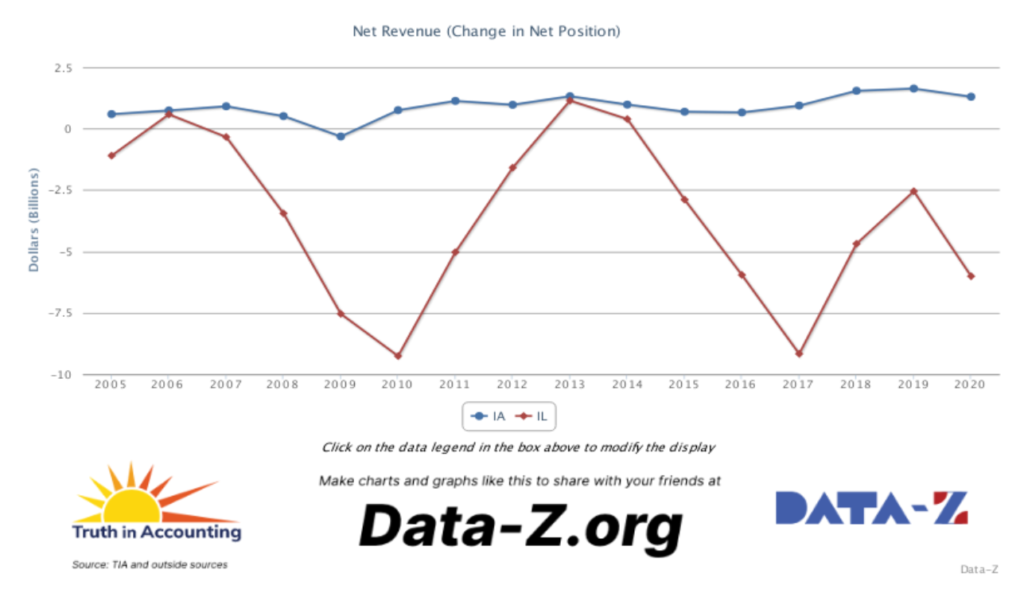
Iowa (the blue line) maintained positive net revenue in 15 of the 16 years. Illinois, on the other hand, did so in only three of those 16 years.
The frequency of truly-balanced-budgets, as indicated by “Net Revenue,” provides significant explanatory power (in econometrics-speak) for two important measures of state government performance – Truth in Accounting’s “Taxpayer Burden” measure of overall financial condition and rankings of the states on the latest Gallup results for a survey of trust in state government.
In our latest (2021) Financial State of the States report on state government finances, Iowa ranked 9th, while Illinois ranked 48th. And in the latest Gallup poll on trust in state government, Iowa ranked 8th, while Illinois ranked 50th (dead last).
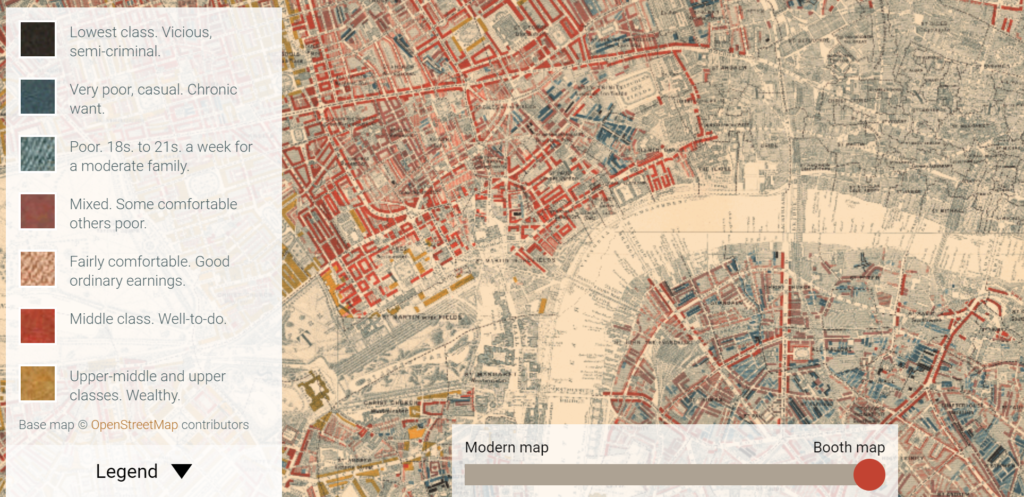
The Maps Descriptive of London Poverty are perhaps the most distinctive product of Charles Booth’s Inquiry into Life and Labour in London (1886-1903). An early example of social cartography, each street is coloured to indicate the income and social class of its inhabitants.
….
Descriptive Map of London Poverty 1889
The first edition of the poverty maps was based on information gathered from School Board visitors. A first sheet covering the East End was published in the first volume of Labour and Life of the People, Volume 1: East London (London: Macmillan, 1889) as the Descriptive Map of East End Poverty. The map was expanded in 1891 to four sheets – covering an area from Kensington in the west to Poplar in the east, and from Kentish Town in the north to Stockwell in the south – and published in subsequent volumes of the survey. These maps are collectively known as the Descriptive Map of London Poverty 1889. They use Stanford’s Library Map of London and Suburbs at a scale of 6 inches to 1 mile (1:10560) as their base. A digital image of the 1889 map has been made by the University of Michigan.
The original working maps from this first edition of the poverty maps are held at the Museum of London. These are hand-coloured and use the 1869 Ordnance Survey 1:2500 maps as their base.
Wall Street’s three biggest municipal-bond underwriters have seen business grind to a halt in Texas after the state blocked governments from working with banks that have curtailed gun-industry ties. In June, as Goldman Sachs Group Inc. was on the hunt for a new campus in Dallas, Republican Governor Greg Abbott took a shot at ESG initiatives by banning state investments in businesses that cut ties with oil and gas companies.
That’s not to mention the brawls over Covid vaccines and mask mandates, deadly Texas blackouts along the country’s most isolated power grid and new state laws that restrict voting and all but ban abortion. It’s all happening just as Wall Street’s shareholders push the industry to fight climate change, racism and the gender gap.
….
So far, most big banks haven’t taken public positions on the new abortion restrictions. They’re being cautious about requiring Covid-19 vaccinations for employees in places where officials have assailed mandates. But the new Texas gun law is running into both the industry’s efforts to advance social causes and its ability to work with the second-largest state for muni-bond issuance.
JPMorgan Chase & Co. — which has 25,500 Texas employees, its most in any state outside New York — has said it can’t bid on most business with public entities in Texas because of ambiguities around the law. The biggest U.S. bank is assessing its potential next steps, said a person with knowledge of the company’s thinking.
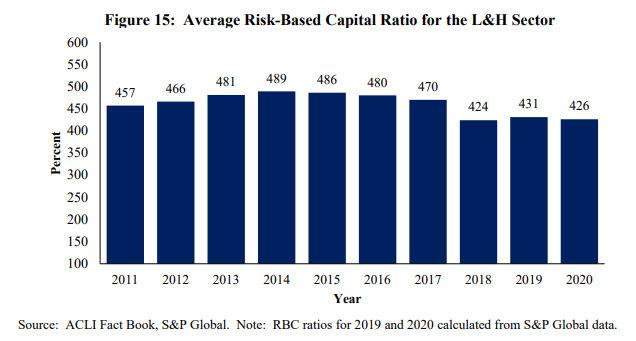
Figure 15 shows that the average risk-based capital ratio for the L&H sector declined slightly in
Specifically, statutory capital and surplus was 4.26 times the level of minimum required regulatory capital on average in 2020 compared to 4.31 times the required level in 2019.
L&H sector net income of $22 billion in 2020 was less than one-half of 2019 levels, affecting the potential for capital generation. The sector reported a nearly 10 percent increase in death and annuity benefit expenses, which contributed to a ratio of total benefit expenses to premiums earned of 50 percent in 2020, rising substantially from 44.4 percent in 2019. According to Fitch Ratings, life insurer operating results in 2020 were largely impacted by higher claims paid, primarily due to increased mortality from COVID-19.24
Certain leverage ratios indicate that L&H insurers faced balance sheet pressures in 2020. The greater financial flexibility afforded by steady leverage ratios has enabled insurers to consistently fulfill policyholder obligations by: (1) returning a profit by investing the premiums received from underwriting activities; and (2) limiting the risk exposure from the policies underwritten. Insurers also employ reinsurance in order to move some of the risks off their own balance sheets and on to those of reinsurers. Figure 16 provides a view of the L&H sector’s general account leverage for the last 10 years.
A $66 billion Pennsylvania state pension fund under scrutiny for errors in calculating investment returns has been asked by securities regulators to turn over records related to possible gifts exchanges with dozens of Wall Street firms, according to a subpoena reviewed by Bloomberg.
SEC Enforcement Division Senior Counsel Heidi Mitza asked that the pension fund supply “all Documents and Communications Concerning any compensation, remuneration, money, gifts, gratuities, trips or anything of any value” exchanged between representatives of investment managers, advisers, and consultants and any representatives of PSERS or the state, according to the subpoena.
Variations in the age patterns and magnitudes of excess deaths, as well as differences in population sizes and age structures, make cross-national comparisons of the cumulative mortality impacts of the COVID-19 pandemic challenging. Life expectancy is a widely used indicator that provides a clear and cross-nationally comparable picture of the population-level impacts of the pandemic on mortality.Methods
Life tables by sex were calculated for 29 countries, including most European countries, Chile and the USA, for 2015–2020. Life expectancy at birth and at age 60 years for 2020 were contextualized against recent trends between 2015 and 2019. Using decomposition techniques, we examined which specific age groups contributed to reductions in life expectancy in 2020 and to what extent reductions were attributable to official COVID-19 deaths.Results
Life expectancy at birth declined from 2019 to 2020 in 27 out of 29 countries. Males in the USA and Lithuania experienced the largest losses in life expectancy at birth during 2020 (2.2 and 1.7 years, respectively), but reductions of more than an entire year were documented in 11 countries for males and 8 among females. Reductions were mostly attributable to increased mortality above age 60 years and to official COVID-19 deaths.Conclusions
The COVID-19 pandemic triggered significant mortality increases in 2020 of a magnitude not witnessed since World War II in Western Europe or the breakup of the Soviet Union in Eastern Europe. Females from 15 countries and males from 10 ended up with lower life expectancy at birth in 2020 than in 2015.
Author(s): José Manuel Aburto, Jonas Schöley, Ilya Kashnitsky, Luyin Zhang, Charles Rahal, Trifon I Missov, Melinda C Mills, Jennifer B Dowd, Ridhi Kashyap
Publication Date: 26 Sept 2021
Publication Site: International Journal of Epidemiology
Figure 3. Power functions based on the IDL (excluding French records), France 2019 and ISTAT databases and combined dataset, with rugs showing the lifetimes above 115. (a) Power for testing the null hypothesis of infinite endpoint against the alternative of a finite endpoint ι, based on the likelihood ratio statistic. The endpoint cannot be below the largest lifetime in each database. (b) Power of the Wald statistic for testing the null hypothesis γ = 0 against the one-sided alternative γ < 0, as a function of γ; the dashed line represents the power obtained by rejecting exponentiality when any of the three one-sided tests rejects. The curves are obtained by conditioning on the birthdates and left-truncated values in the databases, then simulating generalized Pareto data whose parameters are the partial maximum likelihood estimates (σˆγ,γ). The simulated records are censored if they fall outside the sampling frame for the ISTAT data and are simulated from a left- and right-truncated generalized Pareto distribution for IDL and France 2019. See appendix A.6 for more details.
Abstract:
We use a combination of extreme value statistics, survival analysis and computer-intensive methods to analyse the mortality of Italian and French semi-supercentenarians. After accounting for the effects of the sampling frame, extreme-value modelling leads to the conclusion that constant force of mortality beyond 108 years describes the data well and there is no evidence of differences between countries and cohorts. These findings are consistent with use of a Gompertz model and with previous analysis of the International Database on Longevity and suggest that any physical upper bound for the human lifespan is so large that it is unlikely to be approached. Power calculations make it implausible that there is an upper bound below 130 years. There is no evidence of differences in survival between women and men after age 108 in the Italian data and the International Database on Longevity, but survival is lower for men in the French data.
Author(s): Léo R. Belzile, Anthony C. Davison, Holger Rootzén and Dmitrii Zholud