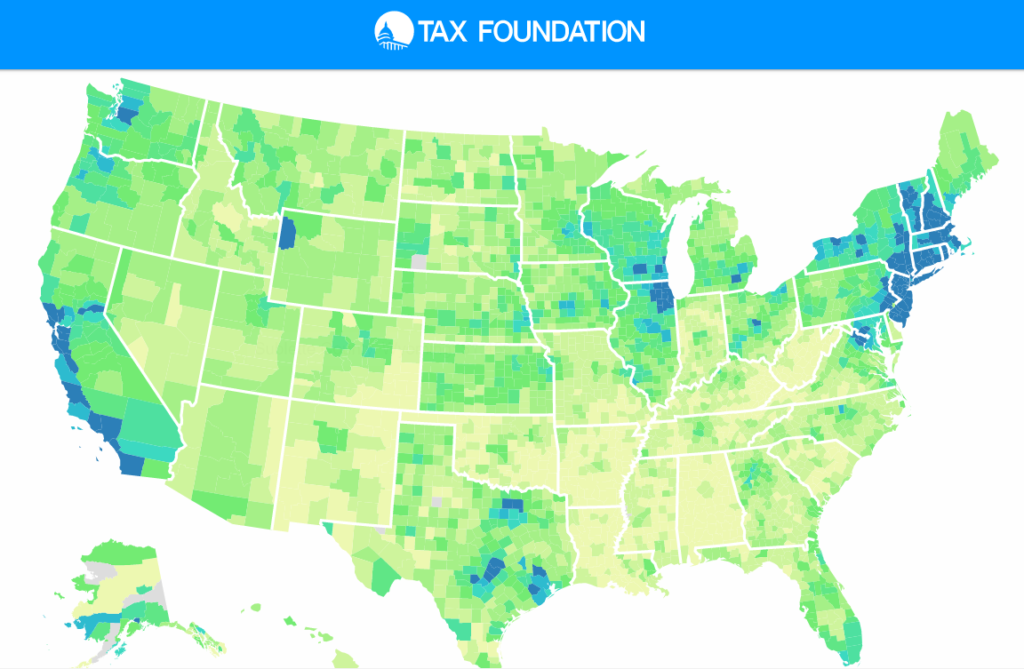
Property taxes are the primary tool for financing local government and generate state-level revenue in some states as well. In fiscal year 2019, property taxes comprised 31 percent of total state and local tax collections in the United States, more than any other source of tax revenue. In that same year, property taxes accounted for 72 percent of local tax collections and 27 percent of overall local government revenue.
…..
The six counties with the highest median property tax payments all have bills exceeding $10,000—Bergen, Essex, and Union Counties in New Jersey, and Nassau, Rockland, and Westchester counties in New York. All six are near New York City, as is the next highest, Passaic County, New Jersey ($9,881).
According to a lawsuit filed this week by Tobe, the pension denied most of his requests for records under the Illinois Freedom of Information Act. It’s no secret that state and local government pensions—which are supposed to be the most transparent of all pensions—are regularly criticized for opposing public record requests, particularly related to alternative investment documents.
The report accuses the pension of failing to monitor and fully disclose investment fees and expenses. It is estimated that fees and expenses could be 10 times greater than the $7.4 million disclosed in the pension’s most recent financial audit. Tobe believes the fees related to dozens of investment managers are not properly disclosed. Using assumptions from an Oxford study, Tobe estimated that undisclosed fees could be as high as $70 million a year. Also, $2 million to $3 million a year in investment fees may have been paid to Wall Street for doing nothing, i.e., fees on committed, uninvested capital.
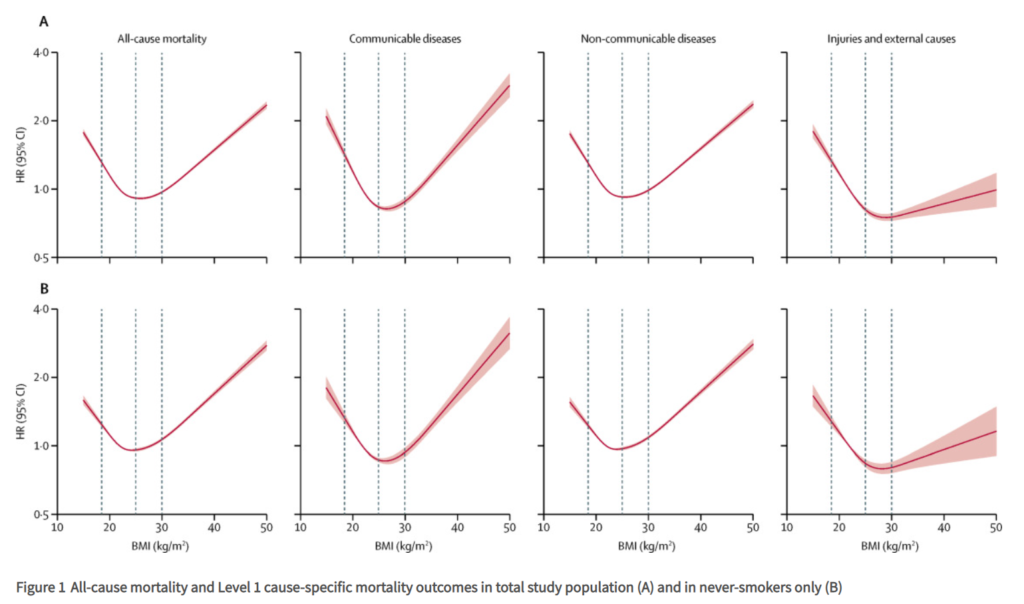
3 632 674 people were included in the full study population; the following results are from the analysis of never-smokers, which comprised 1 969 648 people and 188 057 deaths. BMI had a J-shaped association with overall mortality; the estimated hazard ratio per 5 kg/m2 increase in BMI was 0·81 (95% CI 0·80–0·82) below 25 kg/m2 and 1·21 (1·20–1·22) above this point. BMI was associated with all cause of death categories except for transport-related accidents, but the shape of the association varied. Most causes, including cancer, cardiovascular diseases, and respiratory diseases, had a J-shaped association with BMI, with lowest risk occurring in the range 21–25 kg/m2. For mental and behavioural, neurological, and accidental (non-transport-related) causes, BMI was inversely associated with mortality up to 24–27 kg/m2, with little association at higher BMIs; for deaths from self-harm or interpersonal violence, an inverse linear association was observed. Associations between BMI and mortality were stronger at younger ages than at older ages, and the BMI associated with lowest mortality risk was higher in older individuals than in younger individuals. Compared with individuals of healthy weight (BMI 18·5–24·9 kg/m2), life expectancy from age 40 years was 4·2 years shorter in obese (BMI ≥30·0 kg/m2) men and 3·5 years shorter in obese women, and 4·3 years shorter in underweight (BMI <18·5 kg/m2) men and 4·5 years shorter in underweight women. When smokers were included in analyses, results for most causes of death were broadly similar, although marginally stronger associations were seen among people with lower BMI, suggesting slight residual confounding by smoking.
Author(s):
Krishnan Bhaskaran, PhD Prof Isabel dos-Santos-Silva, PhD Prof David A Leon, PhD Ian J Douglas, PhD Prof Liam Smeeth, PhD
Americans last year saw their first significant decline in household income in nearly a decade, government data showed, with economic pain from the Covid-19 pandemic prompting government aid that helped keep millions from falling into poverty.
An annual assessment of the nation’s financial well-being, released Tuesday by the Census Bureau, offered insight into how households fared during the pandemic’s first year. It arrives as Washington debates how much more to spend to bolster the economy during the worst public-health crisis in a century.
Median household income was about $67,500 in 2020, down 2.9% from the prior year, when it hit an inflation-adjusted historical high. It came as the U.S. last year saw millions lose their jobs and national unemployment soar from a 50-year low to a high of 14.8%.
The last time median household income fell significantly was 2011, in the aftermath of the 2007-09 recession.
The Census Bureau’s topline income figure includes unemployment benefits but doesn’t account for income and payroll taxes nor stimulus checks or other noncash benefits like federal food programs. If those had been counted, the median household income would have risen 4% to $62,773.
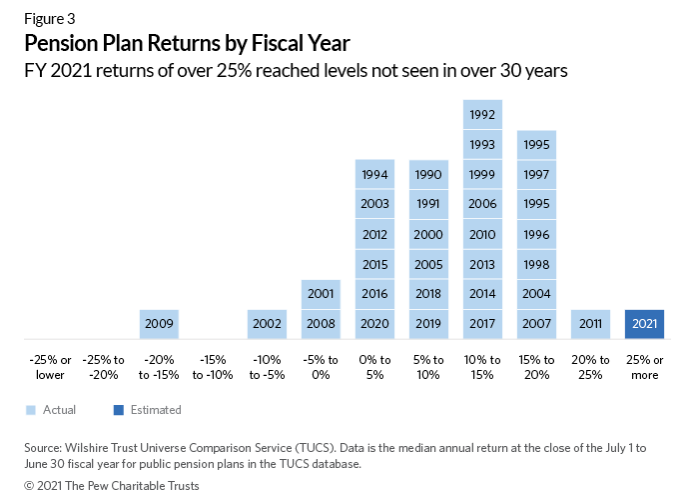
Most analysts attribute the strong market performance to historically low interest rates and an unprecedented $5 trillion in federal stimulus in response to the pandemic. In addition, the economy is now recovering at a rapid pace, with recent projections by the Congressional Budget Office, Moody’s, and the Federal Reserve forecasting a return to pre-pandemic levels of gross domestic product by calendar year 2022 or before.3
However, the path to recovery remains uncertain, and the long-term forecast for economic growth and pension investment returns is less rosy. The Congressional Budget Office expects average real economic growth of 1.6% between 2026 and 2031 and nominal growth of 3.7% over the same time frame—significantly lower than the historical average.4 As such, market experts now estimate equity returns, which are related to economic growth and current market value of stocks, to be 6.4% over the long term, compared with 6.7% before the pandemic.5 And with interest rates currently lower than pre-pandemic levels, they also project bonds to yield just 2% over the next decade before returning to the pre-pandemic expected yield of about 4%.6
The annual cost-of-living adjustment, or COLA, for Social Security benefits in 2022 — usually announced in October — could be 6% to 6.1%, the highest since 1983, based on Tuesday’s Consumer Price Index announcement, according to Social Security and Medicare policy analyst Mary Johnson of The Senior Citizens League, who estimated the 2022 COLA would be 6.2% a month ago.
The latest estimate, which is based on inflation of 0.3% in August, is especially significant as next year’s COLA will be calculated on the average of third-quarter, or July, August and September, CPI data.
…..
The consumer price index for all urban consumers in August rose 5.3% over the past 12 months, and 0.3% from the previous month, the Labor Department reported Tuesday. (The CPI includes food and energy.)
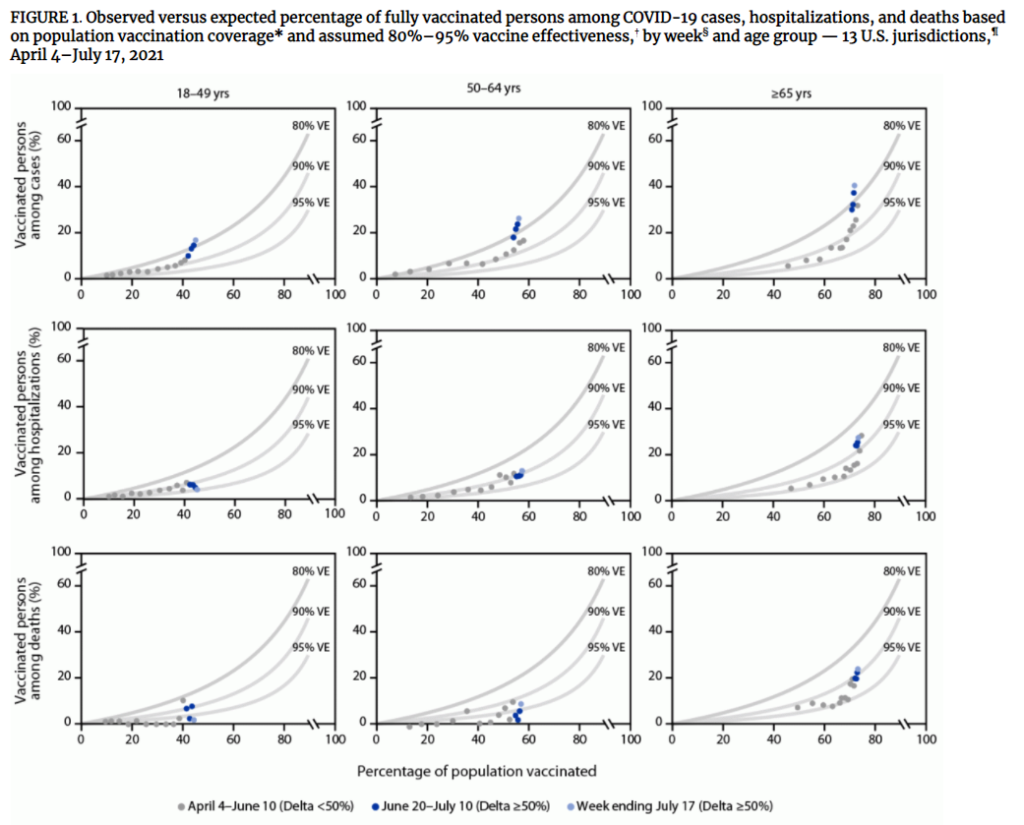
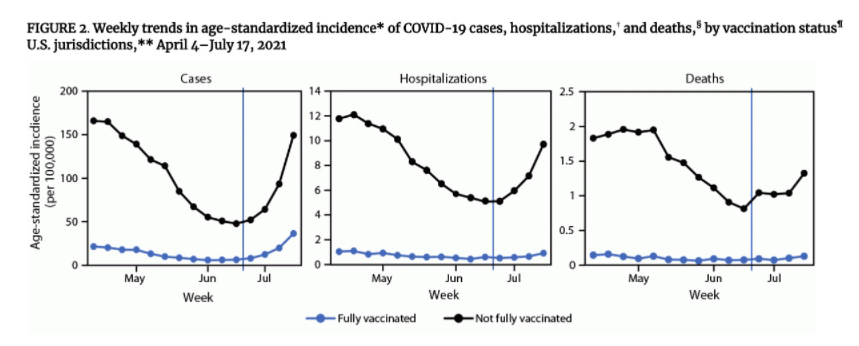
Averaged weekly, age-standardized rates (events per 100,000 persons) were higher among persons not fully vaccinated than among fully vaccinated persons for reported cases (112.3 versus 10.1), hospitalizations (9.1 versus 0.7), and deaths (1.6 versus 0.1) during April 4–June 19, as well as during June 20–July 17 (89.1 versus 19.4; 7.0 versus 0.7; 1.1 versus 0.1, respectively). Higher hospitalization and death rates were observed in older age groups, regardless of vaccination status, resulting in a larger impact of age-standardization on overall incidence for these outcomes.
Within each age group, the percentage of vaccinated persons among cases, hospitalizations, and deaths increased with increasing vaccination coverage (Figure 1). As the prevalence of SARS-CoV-2 Delta variant surpassed 50%, the percentage of vaccinated persons among cases in each age group increased at rates corresponding to benchmarks for lower VE (i.e., from approximately 90% to <80%). Increases in the percentages of vaccinated persons aged ≥65 years among COVID-19–associated hospitalizations and deaths also appeared higher than expected. During June 20–July 17, age-standardized rates of cases, hospitalizations, and deaths among persons not fully vaccinated increased weekly; among fully vaccinated persons, case rates increased, but rates of hospitalizations and deaths remained largely unchanged (Figure 2).
Author(s): Heather M. Scobie, PhD1; Amelia G. Johnson, DrPH1; Amitabh B. Suthar, PharmD2; Rachel Severson, MS3; Nisha B. Alden, MPH3; Sharon Balter, MD4; Daniel Bertolino, MPH5; David Blythe, MD6; Shane Brady, MPH7; Betsy Cadwell, MSPH1; Iris Cheng, MS5; Sherri Davidson, PhD8; Janelle Delgadillo9; Katelynn Devinney, MPH5; Jeff Duchin, MD10; Monique Duwell, MD6; Rebecca Fisher, MPH4; Aaron Fleischauer, PhD11; Ashley Grant, MPH12; Jennifer Griffin, PhD4; Meredith Haddix, MPH4; Julie Hand, MSPH12; Matt Hanson, MD10; Eric Hawkins, MS13; Rachel K. Herlihy, MD3; Liam Hicks, MPH7; Corinne Holtzman, MPH14; Mikhail Hoskins, MPH11; Judie Hyun, MHS6; Ramandeep Kaur, PhD8; Meagan Kay, DVM10; Holly Kidrowski, MPH14; Curi Kim, MSPH6; Kenneth Komatsu, MPH7; Kiersten Kugeler, PhD1; Melissa Lewis, MPH1; B. Casey Lyons, MPH2; Shelby Lyons, MPH12; Ruth Lynfield, MD14; Keegan McCaffrey7; Chelsea McMullen, MS15; Lauren Milroy, MPH13; Stephanie Meyer, MPH14; Leisha Nolen, MD9; Monita R. Patel, PhD1; Sargis Pogosjans, MPH10; Heather E. Reese, PhD1; Amy Saupe, MPH14; Jessica Sell, MPH5; Theresa Sokol, MPH12; Daniel Sosin, MD15; Emma Stanislawski, MPH15; Kelly Stevens, MS8; Hailey Vest, MPH13; Kelly White, MPH13; Erica Wilson, MD11; Adam MacNeil, PhD1; Matthew D. Ritchey2; Benjamin J. Silk, PhD1
Publication Date: 10 Sept 2021
Publication Site: CDC, Morbidity and Mortality Weekly Report
Here is a fairly clear picture from the CDC of the impact of vaccination on infections (cases), Hospitalizations and Deaths, through July. You can see here that infections are increasing for vaccinated people, hospitalizations and deaths are increasing also, but to a much lesser degree. In all cases, the fully vaccinated people are experiencing infections, hospitalizations, and deaths at a much lower level than the Not Fully Vaccinated people.
That is the message we keep hearing, but I find that this picture tells the story better than the words.
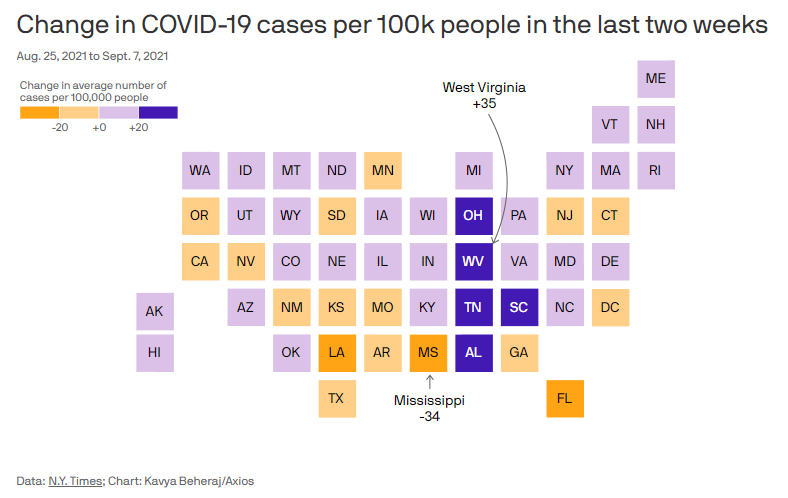
Details: A small number of states, including Florida, Louisiana and Mississippi, still have high numbers but have continued to see an improvement over the past two weeks.
For instance, Florida saw a 23% drop in cases and a 17% drop in hospitalizations over the last two weeks. But the state still has 345 daily COVID deaths on average.
Meanwhile, the biggest increases in new cases continue to be clustered in the South — including Tennessee, Alabama and South Carolina — as well as in Ohio and West Virginia.
States around the country have reported that COVID surges are increasing the strain on hospital systems. This week, Idaho hospitals begin rationing health care amid COVID surges, West Virginia reported record high ICU and ventilator cases, and Wisconsin hospitals said their ICU beds are in short supply.
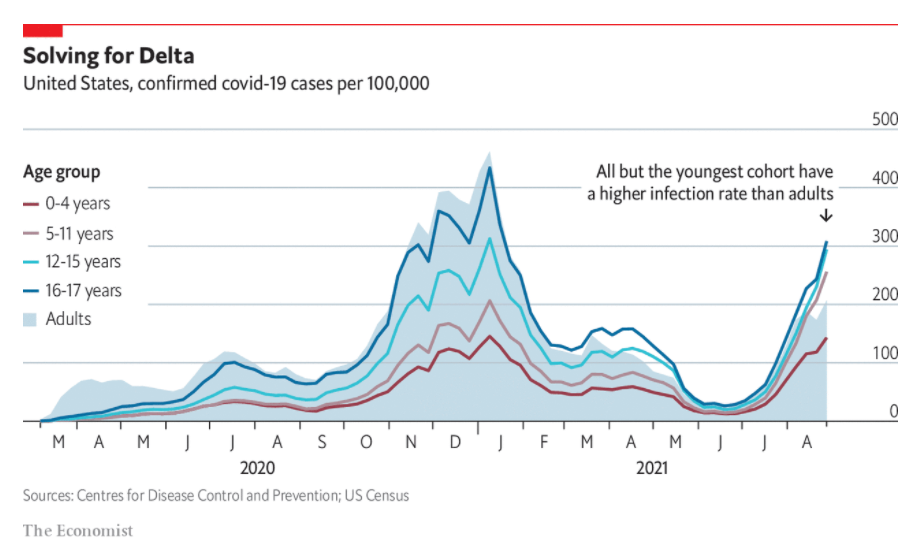
ON SEPTEMBER 13TH pupils in New York City, America’s biggest school district, will make a full return to classrooms for the first time since the start of the pandemic. That will be a relief for many parents. But it will also bring fear. In America, until recently adults suffered the highest infection rates; today the virus is spreading fastest among young people (see chart). Cases in children are surging, accounting for more than a quarter of total infections in the country in the week ending September 2nd.
Compared with other school districts, New York City is something of a straggler. Pupils in Tuloso-Midway School District in Texas have been back at their desks since the middle of July. Children in Los Angeles, the country’s second-largest school district, began their studies four weeks ago. Parents in New York City will doubtless be wondering whether and how the return to school elsewhere has contributed to the recent spike in cases among young people.
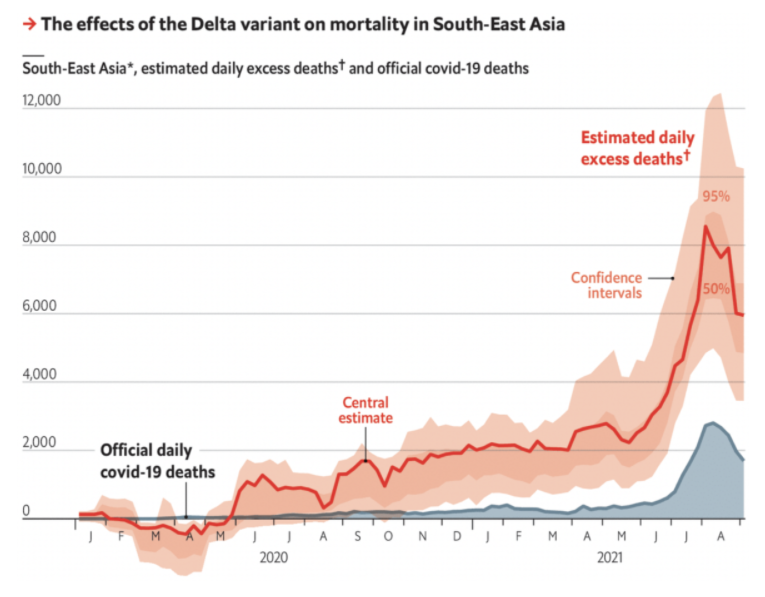
As news circulated of a worrying new virus spreading in the Chinese city of Wuhan in the early days of 2020, experts worried that infections would quickly reach South-East Asia and overwhelm the region’s health-care systems. Thailand was one of the main destinations for Chinese tourists; the first case outside China was reported there on January 13th, 2020. The first known death from covid-19 outside China occurred in the Philippines. A Chinese tourist who had visited Indonesia from Wuhan tested positive on returning home, suggesting he took the virus on holiday with him.
Yet it was Iran and Italy that became the first global hotspots. America, the rest of Europe and Brazil were soon engulfed. India got walloped. All through 2020 and the early part of this year, South-East Asia remained relatively unscathed. By the start of June, the region of 668m people had reported fewer than 77,000 deaths from the disease. Britain, with a tenth as many people, had chalked up more than 128,000. South-East Asia, it seemed, had escaped the worst of the pandemic.
The clock currently reads $28 trillion, give or take, and will grow rapidly in the coming years. The coronavirus pandemic has cost the U.S. economy $16 trillion, give or take, and Congress appropriated more than $3 trillion in aid in 2020.
…..
The United States has had an up-and-down relationship with debt. One of Congress’s first actions was to assume states’ Revolutionary War debt in exchange for moving the country’s permanent capital to Washington, D.C. Alexander Hamilton saw collective debt as a way to build the nation — and its international credit — and bind the several states together in common cause.
…..
“I believe it a national curse,” Jackson said in 1824. “My vow shall be to pay the national debt, to prevent a monied aristocracy from growing up around our administration that must bend it to its views, and ultimately destroy the liberty of our country.”
Jackson followed through on his promise, vetoing virtually every spending bill and using federal funds to pay down the debt until it was fully paid off in 1837 — right before a six-year economic depression that pumped it back up again.
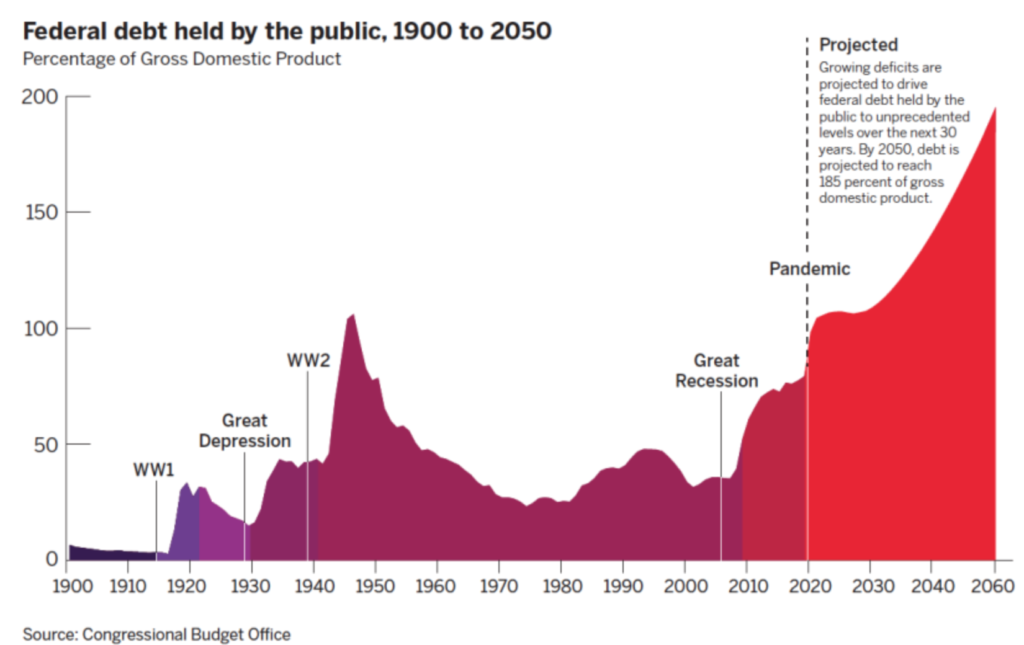
World War II ballooned the debt as the nation ratcheted up defense spending to finance the war, causing the country’s debt to rise to more than 100% of gross domestic product. (Debt is usually measured as a percentage of GDP to make it comparable across different periods of time.)