Stark Inequality: Financial Asset Inequality Undermines Retirement Security

Link to full report: https://www.nirsonline.org/wp-content/uploads/2021/08/Stark-Inequality-F2.pdf

Graphic:

Excerpt:

Inequality in the ownership of financial assets both persists and deepens over time. The top five percent of Baby Boomers by net worth owned a greater percentage of that generation’s financial assets in 2019 (58 percent) than in 2004 (52 percent).

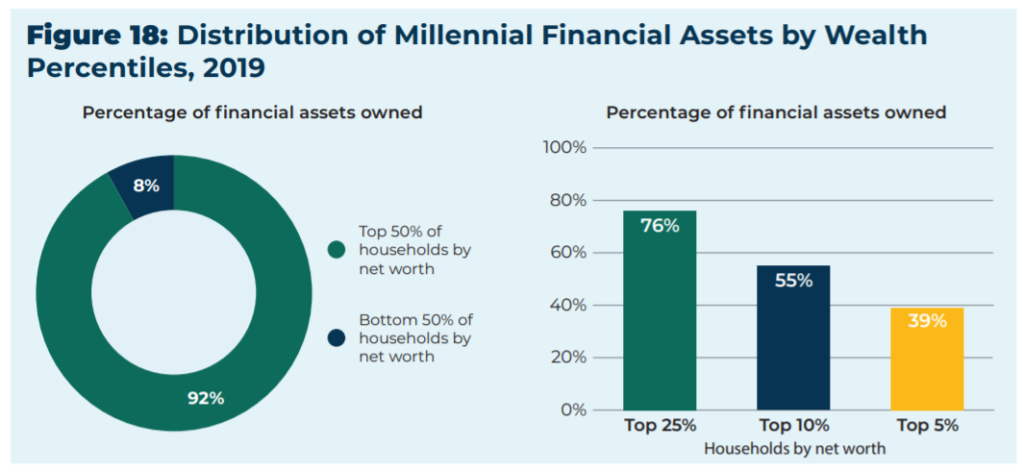
Inequality in the ownership of financial assets is consistent across generations. In 2019, the top 25 percent by net worth of Millennials, Generation X, and Baby Boomers owned three-quarters or more of their generation’s financial assets.

Financial asset ownership is highly concentrated among white households. In 2019, white households in all three generations owned three-quarters or more of their generation’s financial assets. Ownership is especially concentrated among white households in the top 25 percent of net worth.

Both mean and median financial assets were significantly higher for white households in 2019 than Black or Hispanic households.

A range of potential solutions exists to address this stark inequality including strengthening and expanding Social Security, protecting pensions, increasing access to savings-based plans for low-income workers, and reforming retirement tax incentives.

Author(s): Tyler Bond

Publication Date: September 2021

Publication Site: National Institute on Retirement Security

Teacher Retirement Systems: A Ranking of the States

Link: https://bellwethereducation.org/publication/retirement-systems-ranking

Graphic:

Excerpt:

Teacher retirement plans are called “gold plated” by their proponents and critics alike, when in fact half of teachers will never see a pension at all. Only about one in five teachers gets a full pension. And in many cases retirement benefits shortchange teachers and make it harder for them to save for their retirement

In Teacher Retirement Systems: A Ranking of the States, Bellwether Education Partners ranks how state retirement systems serve U.S. teachers and taxpayers:

….

Retirement programs don’t serve all teachers equitably. For teachers who work in the classroom for fewer than 10 years, 34 states receive an “F” for how well retirement plans prepare them for retirement. For teachers who work in the classroom for more than 10 years, but do not stay until retirement age, 23 states receive an “F” ranking.

Link to full report: https://bellwethereducation.org/sites/default/files/Teacher%20Retirement%20Systems%20-%20A%20Ranking%20of%20the%20States%20-%20Bellwether%20Education%20Partners%20-%20FINAL.pdf

Author(s):

MAX MARCHITELLO
ANDREW J. ROTHERHAM
JULIET SQUIRE

Publication Date: 31 August 2021

Publication Site: Bellwether Education Partners

Teacher Retirement Systems: A Ranking of the States

Graphic:

Excerpt:

Bellwether Education Partners is a “national nonprofit focused on dramatically changing education and life outcomes for underserved children. [They] do this by helping education organizations accelerate their impact and by working to improve policy and practice.” And making good money* doing whatever that means.

Apparently this think tank got some interns to go through official teacher pension data reported by the 50 states and the District of Columbia to come up with rankings. New Jersey was not last overall (probably on account of the ARP money that went into the pension this year) but Medium-term and Long-term New Jersey did come in last…..and by a lot.

Author(s): John Bury

Publication Date: 3 September 2021

Publication Site: burypensions

ARP: “Actuarial Equivalent of a Guillotine”

Excerpt:

Right now on the American Rescue Plan (ARP) website:

Status of Applications [.xls] – Coming Soon

Until those spreadsheets start popping up we have no clue as to why, by whom, and how these bailout applications are being made but, before seeing any numbers, one thing bothers me.

A footnote on that ARP website reads:

**MPRA plans can restore benefits under 26 CFR 1.432(e)(9)-1(e)(3) at any time, including before applying for SFA.

So why aren’t plan participants like Carol Podesta-Smallen in the MarketWatch story not having their monthly pension amounts restored to pre-MPRA levels and getting large checks to make up for past reductions? It would reduce asset values in those plans but isn’t that a good thing when applying for bailout money?

Author(s): John Bury

Publication Date: 31 August 2021

Publication Site: burypensions

‘I’ll be robbed twice in one lifetime’: Retirees fearing financial disaster wait for pension rescue

Link: https://www.marketwatch.com/story/ill-be-robbed-twice-in-one-lifetime-retirees-fearing-financial-disaster-wait-for-pension-rescue-11630018883

Graphic:

Excerpt:

A law passed in Congress earlier this year promised to reverse some of that damage by offering taxpayer-funded financial assistance to certain troubled pension plans like Podesta-Smallen’s, allowing them to restore benefits to retirees who suffered cuts. But the implementation of the rescue plan has been met with a barrage of criticism from plan trustees, participants and members of Congress who say it’s too tight-fisted with the financial assistance and could leave some plans in a worse financial position than they are in now.

….

When the American Rescue Plan was signed into law in March, many of these struggling plans and retirees with sharply reduced benefits thought their troubles were over. The law is expected to provide about $94 billion to eligible multiemployer plans through a financial assistance program designed to stabilize the plans for decades to come and reinstate previously reduced benefits.  

The sense of relief was short-lived, plan trustees and participants say. The Pension Benefit Guaranty Corp., the federal agency charged with protecting the retirement incomes of participants in private-sector defined-benefit pension plans, in early July released regulations detailing the formula for calculating the financial assistance for troubled plans.

In interviews and more than 100 comment letters to the PBGC, plan trustees, consultants, participants and lawmakers say that the rule’s stringent approach to calculating financial assistance means that many plans receiving the assistance won’t make it through the next 30 years as Congress intended, and some won’t even get enough money to cover the benefits they must restore as a condition of getting the cash.

Author(s): Eleanor Laise

Publication Date: 30 August 2021

Publication Site: Marketwatch

More Than An Insolvency Date: What Else To Know About The Social Security And Medicare Trustees’ Reports

Link: https://www.forbes.com/sites/ebauer/2021/09/01/more-than-an-insolvency-date-what-else-to-know-about-the-social-security-and-medicare-trustees-reports/

Excerpt:

This year, Social Security’s deficit is unusually high due to lower revenues and higher benefits: 1.75%. In 2040, the deficit climbs to 3.70% rather than 3.54%. In 2080, the deficit stands at 4.87% rather than 4.59%.

Put another way, if there were no Trust Fund accounting mechanism now, the OASI program would have been able to pay 93% of benefits. This would drop to 76% in 2035 – 2040 – 2045, then drop further to being able to pay 70% of benefits.

What’s more, this year, the actuaries changed several assumptions. They assume that by the year 2036, fertility rates will increase to 2.00 children per woman, an increase from the 2020 report’s assumption of 1.95. They also assume a long-term unemployment rate of 4.5% rather than 5%. At the same time, they calculate alternate projections with more pessimistic assumptions, including a continuingly low fertility rate (1.69), a higher rate of mortality improvement (that is, longer-lived recipients), a higher rate of unemployment (5.5%), and others. In these alternate calculations, the 2040 deficit becomes 6.47% rather than 3.7% (benefits 64% payable), and the 2080 deficit becomes 12.39% rather than 4.87% (benefits 50% payable).

Also consider that, at the moment, there are 2.7 workers for each Social Security recipient (2.8 in 2020). This is forecast to drop to 2.2 in 2040 and ultimately down to 2.1. But if the population trends are those of the pessimistic scenario, then that 2.1 would drop to 1.5 by the year 2080.

Author(s): Elizabeth Bauer

Publication Date: 1 September 2021

Publication Site: Forbes

EXPOSED: How CalPERS Tried and Continues to Try to Cover Up Former Chief Investment Officer Ben Meng’s Misconduct

Excerpt:

But we also have Meng’s unreported stock trades. And Meng’s arrival happened to coincide with a big spike in personal trading violations, which CalPERS attempted to minimize by saying they came mainly from one person.

What if it turns out that the Olson report showed that Meng was a very active trader the entire time he was there? There is no way CalPERS could suppress this information, since it was required to have been reported on the Forms 700.

This would be hugely embarrassing to CalPERS, in that it would show it had hired a CIO who didn’t have his full attention on his very big ticket say job. And it would be vastly worse if Meng as head of the investment operation had been routinely violating SEC requirements for trade pre-approvals to prevent insider trading.

This possibility seems even more likely when you look at the board transcript below. Marlene Timberlake D’Adamo droned on and on and on trying to justify CalPERS not having reviewed Meng’s Form 700 to see if it looked internally consistent and/or matched up with his trading records. At first I thought this was to exhaust the board and dissipate their energy so they’d not be as persistent about their issues when they finally got the mike. But it may also be that the compliance department was clearly remiss in not reviewing Meng’s Form 700 by virtue of him being an active trader. And if he indeed was the person who’d made the big personal trading violations, that would almost mandate reviewing his Form 700.

Author(s): Yves Smith

Publication Date: 31 August 2021

Publication Site: naked capitalism

Florida Alters COVID-19 to Show Artificial Decline in Deaths

Link: https://www.governing.com/now/florida-alters-covid-19-to-show-artificial-decline-in-deaths

Excerpt:

The downloadable data sets on cases and deaths included the report date as well as the date a person died or got sick, allowing journalists and independent researchers to select the best metric for their purposes. The daily reports showed additional cases and deaths added from one day to the next.

In June, as case numbers dropped and vaccination rates continued to rise, the health department discontinued the dashboard and changed to a weekly report. The only near-daily data was submitted by the health department to the CDC and published on the CDC Trend Tracker website.

At first, the data on the CDC website was updated in a largely predictable manner, similar to the way that the DOH had reported daily changes throughout the pandemic. Then on Aug. 10, without warning or any explanation from the health department or the CDC, the data for nearly every day of the previous year changed. Neither agency immediately explained the changes.

Author(s): Sarah Blaskey, Ana Claudio Chacin and Devoun Cetoute, McClatchy Washington Bureau

Publication Date: 31 August 2021

Publication Site: Governing

Every State’s COVID Numbers in Context, August 2021

Link: https://polimath.substack.com/p/every-states-covid-numbers-in-context-cf7

Graphic:

Excerpt:

This region has been the tough one. It looks like we’re on the other side of the case surge in the worst hit states (LA, MS, FL, AL). Daily cases went up much higher than I would have expected, even higher than the winter surge. What has been truly surprising is that Florida is substantially more vaccinated than those other states, about 15-20% higher in adult vaccination and up at 95% vaccinated for seniors. That should shrink their pool of COVID-vulnerable individuals massively and reduce their death rate substantially.

And, while Florida’s death rate is lower than LA and MS, it’s not nearly at the levels we would have hoped or expected. I’m at a loss to explain this. Certain proposals have been tossed around: Florida is an older state, so more of their population is vulnerable. But their vaccination rates (nearly universal coverage among the elderly!) really should suppress this enormously. If a particular age group had +90% vaccination rates, I would expect that group’s COVID deaths to be reduced by at least 70%. Instead, the elderly are still making up the vast majority of COVID deaths in Florida.

Author(s): PoliMath, aka Matt Shapiro

Publication Date: 31 August 2021

Publication Site: Marginally Compelling at substack

Final Report of the Activities of 2019 HMD Project

Link: https://www.soa.org/resources/research-reports/2021/activities-2019-hmd-project/

Full paper:

Graphic:

Excerpt:

Work accomplished under the 2019 agreement between the Human Mortality Database (HMD) team and the
Society of Actuaries (SOA) was divided between two main projects: 1) the continuous development of the United
States Mortality Database (USMDB) and 2) the publication of cause-specific mortality series for selected HMD
countries. Due to administrative delays at both the University of California, Berkeley, and the Society of Actuaries,
work on these projects did not begin until July 2019. Furthermore, due to restriction in data access associated with
the Covid-19 pandemic, a no-cost extension was requested by Magali Barbieri, the Principal Investigator for the
projects, and accepted by the SOA to extend the project beyond the initial December 31, 2019 deadline.

Author(s): Magali Barbieri, Ph.D University of California-Berkeley

Publication Date: August 2021

Publication Site: Society of Actuaries

Social Security Costs Expected to Exceed Total Income in 2021 as Covid-19 Takes Financial Toll

Link: https://www.wsj.com/articles/social-security-costs-expected-to-exceed-total-income-in-2021-as-covid-19-takes-financial-toll-11630436193

Excerpt:

Trustees for the Social Security trust fund in an annual report released Tuesday said the program is expected to pay benefits that exceed its income in 2021, the same as it anticipated last year at the outset of the pandemic.

While the pandemic had a significant impact on the program, the trustees said, they expect Social Security’s reserves to be depleted by 2034, only one year sooner than they estimated in their April 2020 report. Once the reserves are exhausted, benefits would be reduced automatically unless Congress steps in to shore up the program, which lawmakers have done previously.

The trustees now project elevated mortality rates related to the pandemic through 2023, and expect lower immigration and child-bearing this year and next, compared with their 2020 estimates. They also expect the pandemic has lowered worker productivity and thus economic output permanently.

Author(s): Kate Davidson

Publication Date: 31 August 2021

Publication Site: Wall Street Journal