Graphic:

Excerpt:
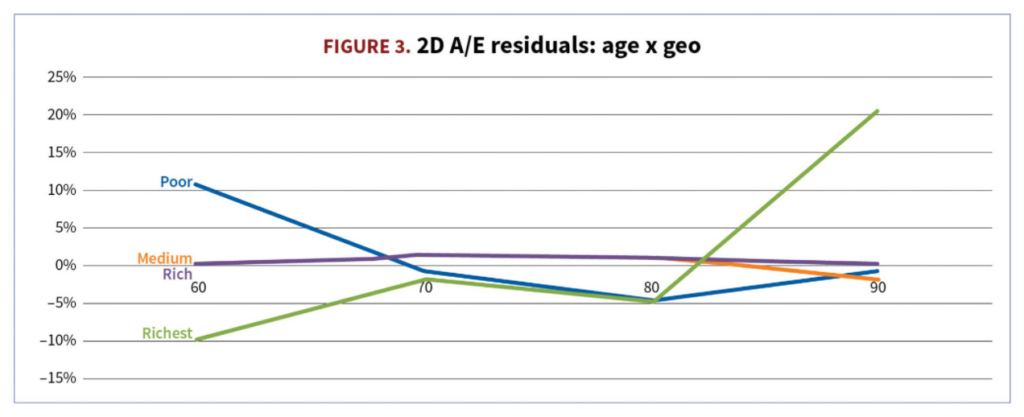
3. Identify pockets of good and poor model performance. Even if you can’t fix it, you can use this info in future UW decisions. I really like one- and two-dimensional views (e.g., age x pension amount) and performance across 50 or 100 largest plans—this is the precision level at which plans are actually quoted. (See Figure 3.)
What size of unexplained A/E residual is satisfactory at pricing segment level? How often will it occur in your future pricing universe? For example, 1-2% residual is probably OK. Ten to 20% in a popular segment likely indicates you have a model specification issue to explore.
Positive residuals mean that actual mortality data is higher than the model predicts (A>E). If the model is used for pricing this case, longevity pricing will be lower than if you had just followed the data, leading to a possible risk of not being competitive. Negative residuals mean A<E, predicted mortality being too high versus historical data, and a possible risk of price being too low.
Author(s): Lenny Shteyman, MAAA, FSA, CFA
Publication Date: September/October 2021
Publication Site: Contingencies