Link: https://www.datablick.com/blog/2021/2/4/a-tableau-accessibility-journey-part-i
Graphic:

Excerpt:
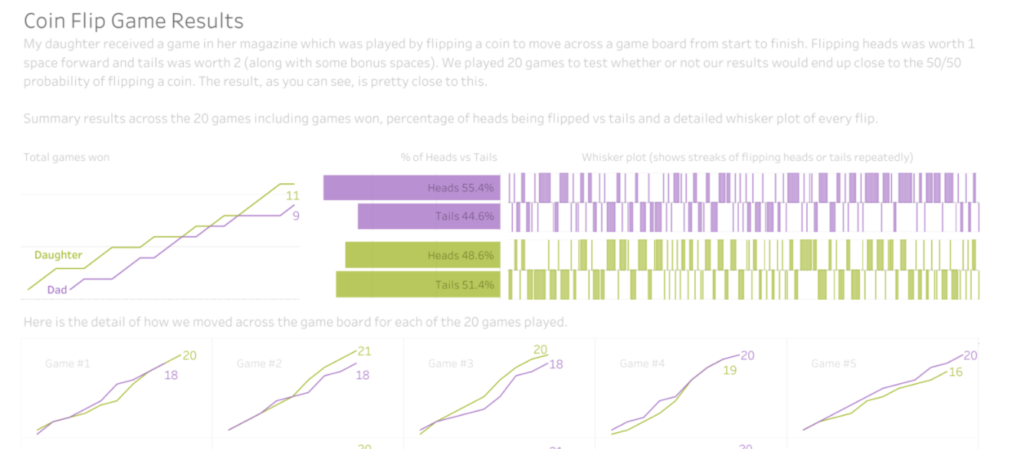
Recently, I came to the realization that 0 of my 58 published data visualizations on my Tableau Public profile provide equal access of their data and storylines for all users, mostly excluding those with disabilities. I have read and studied a lot about developing visuals with care for color blindness, but not so much for blindness itself, or low vision, or users who cannot use a mouse, or many other disabled users. A recent Twitter thread by our colleague Frank Elavsky hits on this topic. It is through these realizations that I decided to join and contribute to the dataviza11y group. A quick plug that we have a great group of people, looking to do some exciting things in this space, so do check out and follow that group and it’s member’s activities if you are interested. A wonderful and recent example is the talk Frank, Sarah Fossheim and Larene Le Gassick presented at Outlier.
Author(s): Chris DeMartini
Publication Date: 8 February 2021
Publication Site: Data Blick