Graphic:

Publication Date: 5 Jan 2026
Publication Site: Treasury Dept
All about risk
Graphic:
Publication Date: 5 Jan 2026
Publication Site: Treasury Dept
Graphic:

Publication Date: 18 Dec 2025
Publication Site: Treasury Dept
Graphic:
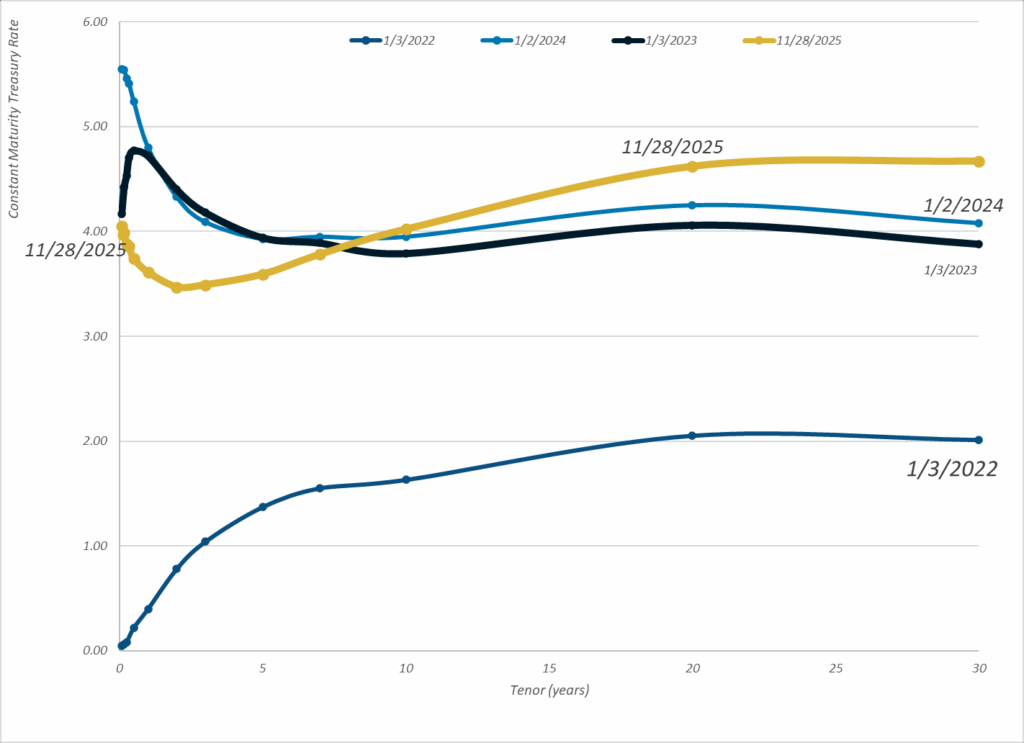
Publication Date: 28 Nov 2025
Publication Site: Treasury Dept
Link: https://static1.squarespace.com/static/5a3a9b9a017db2980fad5f01/t/665720beb5a29c6723e58
Graphic:


Excerpt:
The first thing to understand about bird-on-plane collisions? They’re not the animals’ fault. Swaths of open green space and very few people around make airstrips and their surroundings ideal places for the feathered to, well, flock. As a result, most bird strikes occur during takeoffs and landings. Even off-airport strikes—such as the one involving Sully’s plane—usually happen within five miles of an airport, and at an altitude of 3,000 feet or less.
With 45,000 flights crisscrossing the US every day, odds are good that a handful of airplanes will run into birds. In 1905, Wilbur Wright recorded the first-ever bird strike, over an Ohio cornfield. In 2023, planes hit more than 18,000 birds. The strikes cost the commercial aviation industry roughly $600 million annually in repairs—and if you add in military flights, the total is closer to $650 million.
….
That’s where airports come in. Over the last three decades, the Federal Aviation Administration has recorded every reported midair encounter between bird and plane— roughly 285,000—in the National Wildlife Strike Database. Somewhat amazingly, just 651 bird species have ever been involved. Knowing the specific types of birds that are in their skies helps airports keep them from the flight paths of jumbo jets.
Author(s): Andrew Zaleski
Publication Date: June 2024
Publication Site: Washingtonian
Graphic:
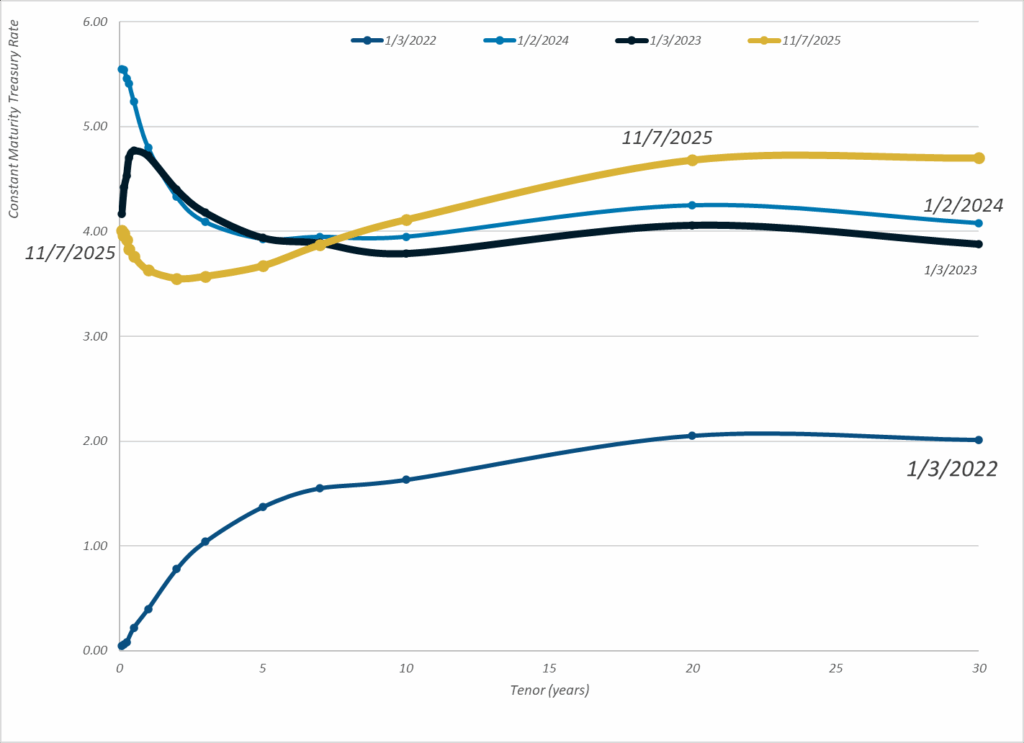
Publication Date: 7 Nov 2025
Publication Site: Treasury Dept
Graphic:
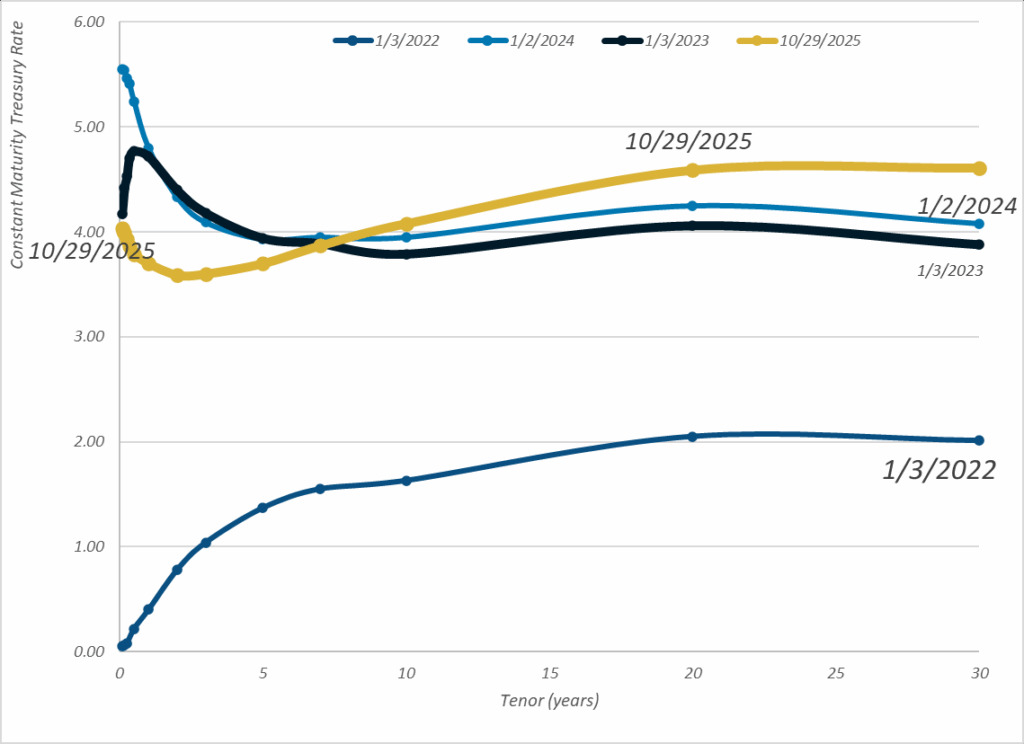
Publication Date: 29 Oct 2025
Publication Site: Treasury Dept
Graphic:

Publication Date: 28 Oct 2025
Publication Site: Treasury Dept
Graphic:
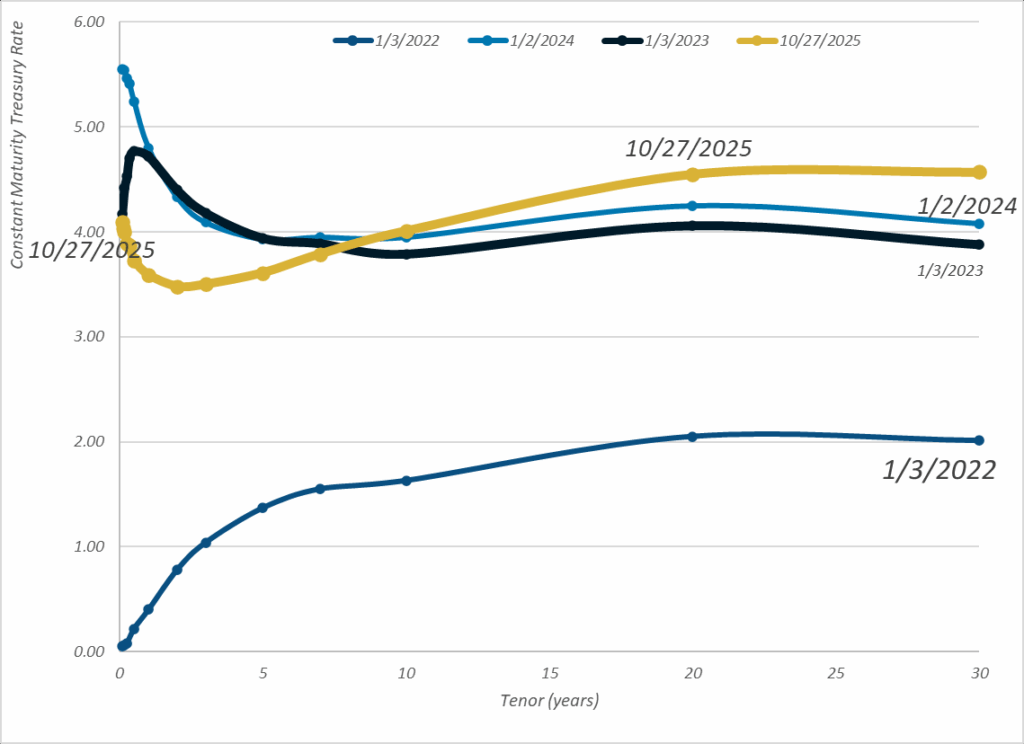
Publication Date: 27 Oct 2025
Publication Site: Treasury Dept
Link: https://www.rstreet.org/commentary/rampant-fraud-in-staged-accidents/
Excerpt:
Whereas the plot of The Fortune Cookie may sound implausible, the reality is that insurance fraud is rampant. Fake and inflated claims are responsible for over $300 billion in claims leakage annually. Staged accidents are among the most grisly types of insurance fraud. Here, organized criminal rings comprising complicit attorneys, medical providers, and actors fake serious road injuries to extract inflated medical reimbursements and proceeds from insurers in civil litigation. Some such schemes have generated tens of millions of dollars in ill-gotten gains.
One recent example is so macabre that it should be made into a movie. Cornelius Garrison was a member of a Louisiana criminal gang actively perpetrating phony injuries in staged accidents. Garrison was a “slammer” in staged automobile “accidents”—a driver who intentionally crashes into other vehicles (preferably 18-wheelers) in order to fraudulently collect insurance settlements. Some have estimated that Garrison participated in close to 100 staged accident scams. But after fellow gang members learned Garrison had turned witness for the Federal Bureau of Investigation (FBI), his life was in danger. Co-conspirators offered to pay him to move to the Bahamas to escape retribution; however, Garrison chose to stay home, where he was murdered in a 10-bullet fusillade.
Staged accident fraud is a growing profit center for criminals. In R Street’s 2023 expert witness testimony to Congress on the seamy side of third-party litigation funding, we cited New York’s $31 million staged accident fraud ring, orchestrated by litigation funder Adrian Alexander. The largest scheme known at the time, it ensnared complicit attorneys and corrupt medical providers known as “medical mills,” engaging in artificial medical bill inflation and upcoding (the submission of claims containing codes for expensive medical services never rendered). Since then, another massive staged accident ring twice the size of Alexander’s has come to light: a $60 million racket that allegedly bribed 911 emergency line operators to direct callers to medical providers controlled by Bradley Pierre, the mastermind behind it.
Author(s): Jerry Theodorou
Publication Date: 16 Sept 2025
Publication Site: R Street
Graphic:
Excerpt:
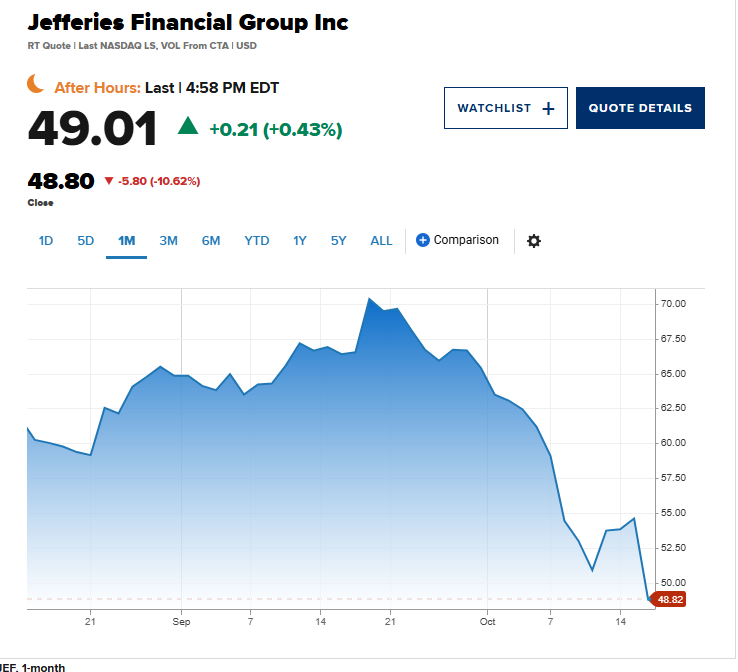
Shares of regional banks and investment bank Jefferies tumbled on Thursday as fears mounted around some bad loans lurking on Wall Street.
Zions Bancorporation dropped more than 10% midday, as did Western Alliance Bancorp. The SPDR S&P Regional Banking ETF (KRE) lost around 4%, with all but one member of the popular fund on track to end Thursday’s session in the red.
….
The worries about the health of the banking industry originated with the bankruptcies of companies related to the auto sector: First Brands and Tricolor Holdings.
Shares of Jefferies, which has exposure to First Brands, fell more than 9% on Thursday. The investment bank’s stock has lost around 23% in October, making it poised to record its worst month since the Covid pandemic took hold in March 2020.
Jefferies said that hedge funds it runs are owed $715 million from companies tied to First Brands, while UBS said that it has about $500 million in exposure.
“When you see one cockroach, there are probably more,” JPMorgan CEO Jamie Dimon said on the company’s earnings conference call earlier this week in relation to First Brands and Tricolor Holdings fallout.
Author(s): Alex Harring, Sarah Min
Publication Date:16 Oct 2025
Publication Site: CNBC
Link: https://content.naic.org/sites/default/files/capital-markets-special-reports-cmbs-ye2024.pdf
Graphic:
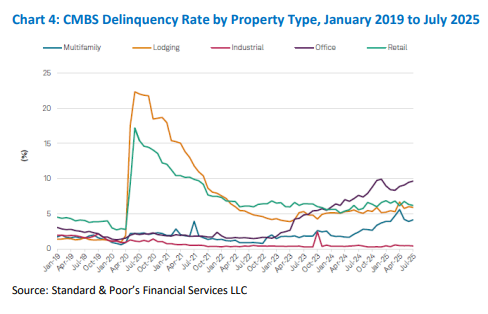
Executive Summary:
Author(s): Michele Wong and Hankook Lee
Publication Date: 16 Oct 2025
Publication Site: NAIC, Capital Markets Special Report

Date posted: 15 Oct 2025
Site: Treasury Dept.